Article Text

Abstract
Background: 5′-AMP-activated protein kinase (AMPK) inactivates critial ensymes in fatty acid and cholesterol synthesis. We hypothesised that the serum lipid profile may be influenced by genetic variation in the AMPK catalytic α2 subunit.
Method: We examined association of 5 tagging SNPs (tSNPs) in the PRKAA2 gene with serum lipids in 2777 normal Caucasian females (mean age 47.4±12.5 years).
Results: All tSNPs were associated with total- and LDL-cholesterol, (p<0.001 to 0.034), explaining variances of 0.13–0.59% and 0.11–0.55% respectively. One haplotype (frequency 34.7%) showed lower total- and LDL-cholesterol compared with the most common haplotype (frequency 45.7%) (p≤0.001), explaining 0.78% of total- and 0.75% of LDL-cholesterol. Another haplotype (frequency 10.5%) was significantly associated with lower HDL-cholesterol (p = 0.005), explaining 0.59% of variance.
Conclusions:PRKAA2 gene variants are significantly associated with serum lipoproteins in a large sample of normal female Caucasians.
- AMPK, 5′-AMP-activated protein kinase
- Apo, apolipoprotein
- GEE, generalised estimating equation
- HDL, high-density lipoprotein
- HMG-CoA, 3-hydroxy-3-methyl-glutaryl-coenzyme A
- LDL, low-density lipoprotein
- MAF, minor allele frequency
- PCR, polymerase chain reaction
- SNP, single-nucleotide polymorphism
- tSNP, tagging single-nucleotide polymorphism
Statistics from Altmetric.com
- AMPK, 5′-AMP-activated protein kinase
- Apo, apolipoprotein
- GEE, generalised estimating equation
- HDL, high-density lipoprotein
- HMG-CoA, 3-hydroxy-3-methyl-glutaryl-coenzyme A
- LDL, low-density lipoprotein
- MAF, minor allele frequency
- PCR, polymerase chain reaction
- SNP, single-nucleotide polymorphism
- tSNP, tagging single-nucleotide polymorphism
Known as the “fuel gauge of the cell”,1 5′-AMP-activated protein kinase (AMPK), is activated by an increase in the cellular AMP:ATP ratio after ATP depletion. Once activated, AMPK switches on ATP-generating (catabolic) pathways and switches off ATP-consuming (anabolic) pathways, allowing the cell to restore its energy balance.2 In addition to its response to acute changes in energy levels in individual cells, AMPK also plays an important part in the regulation of whole-body energy metabolism (see Kahn et al3 for review). For example, in the liver, AMPK phosphorylates and inactivates both acetyl-coenzyme A carboxylase and 3-hydroxy-3-methyl-glutaryl-coenzyme A (HMG-CoA) reductase.4 Acetyl-coenzyme A carboxylase catalyses the biosynthesis of malonyl-CoA, which is the initial substrate for fatty acid synthesis and an inhibitor of carnitine palmitoyl transferase-1, the rate-limiting step for mitochondrial fatty acid oxidation.5 HMG-CoA reductase is the rate-limiting enzyme of cholesterol synthesis.6 AMPK activity therefore inhibits fatty acid and cholesterol biosynthesis and promotes fatty acid oxidation, thereby opposing intracellular lipid accumulation and development of insulin resistance in non-adipose tissues.
Key points
-
Association study of five tagging single-nucleotide polymorphisms (tSNPs) in the 5′-AMP-activated protein kinase α2 subunit gene PRKAA2 in 2777 normal Caucasian women (mean (SD) age 47.4 (12.5) years).
-
All tSNPs were significantly associated with total cholesterol and low-density lipoprotein (LDL)-cholesterol (p<0.001 to 0.034).
-
One haplotype was associated with lower total cholesterol and LDL-cholesterol (all p⩽0.001) and another with lower high-density lipoprotein-cholesterol (p = 0.005), compared with the common haplotype.
AMPK is a heterotrimeric complex comprising a catalytic subunit (α) and two regulatory subunits (β and γ). In humans, there are isoforms of all three subunits, encoded by separate genes. Compared with the wild type, AMPK α2-knockout mice exhibit increased body weight and fat mass when exposed to a high-fat diet,7 and have impaired insulin sensitivity.8 Expression of a constitutively active mutant AMPK α subunit in insulin-resistant human HepG2 cells has been shown to decrease intracellular triglyceride and cholesterol.9
We hypothesised that regulation of the lipid profile, affecting body fat deposition and sensitivity of target organs to insulin, may be potentially mediated by differential expression or activity of the AMPK α2 subunit. No population studies have examined variations in the AMPK α2 subunit gene PRKAA2 with respect to serum lipids or measures of body fat. In a recent study, Sun et al10 found no association between PRKAA2 tagging single-nucleotide polymorphisms (tSNPs) and type 2 diabetes in five independent Caucasian samples, nor with serum glucose and insulin in normal subjects. In another recent study, Horikoshi et al11 found no independent associations between PRKAA2 single-nucleotide polymorphisms (SNPs) and type 2 diabetes in Japanese subjects, but found one associated haplotype, which was replicated in three case–control groups. Neither study measured serum lipids. Recently, Xu et al12 found that rare homozygotes of an intronic SNP in the regulatory AMPK γ2 subunit gene PRKAG2 had significantly higher serum concentrations of triglycerides and total cholesterol than common allele carriers (n = 290; p = 0.01). In Chinese people, therefore, it seems that AMPK γ2 polymorphisms might be associated with lipid metabolism. The γ2 isoform has broad tissue distribution, but the only known functional mutations interfere with AMP activation of AMPK and cause hypertrophic cardiomyopathy associated with Wolff–Parkinson–White syndrome.13
We have used a multistep design in a large study sample to examine association of PRKAA2 variants with adiposity and lipid phenotypes, on a gene-wide level.14 tSNPs effectively capture information of all common variants by taking into account patterns of linkage disequilibrium across the gene.15,16 We tested their effect, individually and as haplotypes, on a range of variables, including anthropometry, serum lipids and body fat distribution, in a sample of Caucasian female twins (n = 2771, mean (SD) age 47.4 (12.5) years) and established strong associations across the gene with serum low-density lipoprotein (LDL)-cholesterol and total cholesterol levels. We have attempted a fine mapping analysis using the tSNPs to predict potential associations between the remaining (ungenotyped) SNPs and serum cholesterol to suggest potential functional sites.15
METHODS
Subjects
The Twins UK Registry comprises unselected, mostly female volunteers ascertained from the general population through national media campaigns in the UK.17 Means and ranges of quantitative phenotypes in Twins UK are normally distributed and similar to the age-matched general population in the UK.18 Informed consent was obtained from all participants before they entered the studies, which were approved by the local research ethics committee. Table 1 shows the characteristics of the subjects. Sixteen subjects using lipid-lowering agents were excluded for the analysis of lipid profiles.
Characteristics of subjects
Zygosity, body composition and biochemical analyses
Zygosity in the Twins UK sample was determined by a standardised questionnaire and confirmed by DNA fingerprinting. Serum leptin concentration determined after an overnight fast, body fat measures determined by dual x ray absorptiometry and fasting insulin and glucose measurements including oral glucose tolerance test were as described previously.19 Blood samples were collected for determination of fasting lipids after a minimum 8-h overnight fast. Serum was stored at −40°C until analysed using a Cobas Fara machine (Roche Diagnostics, Lewes, UK).20 A colorimetric enzymatic method was used to determine total cholesterol, triglycerides and high-density lipoprotein (HDL)-cholesterol levels. The HDL-cholesterol level was measured after precipitation from chylomicron, LDL and very low-density lipoprotein particles by magnesium and dextran sulphate. Apolipoprotein (Apo)A1 and ApoB were assayed by an immunoturbidometric method. The Friedewald equation21 was used to calculate LDL-cholesterol levels in subjects with triglycerides ⩽4.52 mmol/l.
Genotyping for SNP validation and tSNP selection
We used the National Center for Biotechnology Information (http://www.ncbi.nlm.nih.gov/SNP/) and Children’s Hospital Informatics Program Bioinformatics (http://snpper.chip.org) databases to choose SNPs for validation and tSNP selection in our cohort. A total of 27 SNPs validated in the database populations were selected for confirmation in the Twins UK cohort, by genotyping 16 random unrelated subjects, using polymerase chain reaction (PCR) and restriction digest. Primers and PCR conditions are given in supplementary table A (available at http://jmg.bmjjournals.com/supplemental). SNPs that were heterozygotic in at least one sample were further genotyped in 94 unrelated subjects for tSNP selection. Five tSNPs (rs1124900, rs2796516, rs2746342, rs2796498 and rs1418442) were selected. These cover all common PRKAA2 SNPs (minor allele frequency (MAF) >6%) on the HapMap database (HapMap Data Rel#20/phase II Jan 2006; http://www.hapmap.org), with RL2>95%.15 Of the 34 HapMap SNPs, eight were not polymorphic and six had MAF <6%. Twenty with MAF >6% included our five tSNPs.
Genotyping in cohorts
Of the five tSNPs selected, three (rs2796516, rs2746342 and rs2796498) were genotyped by Pyrosequencing (Biotage, Uppsala, Sweden). Two SNPs refractory to genotyping by Pysosequencing (rs1124900 and rs1418442) were genotyped in the complete cohort by KBiosciences (Hoddesdon, Hertfordshire, UK) using the KASPar system. This is a fluorescence-based allele-specific PCR with improved robustness and discriminating power over conventional amplification refractory mutation systems (http://www.kbioscience.co.uk/chemistry/chemistry-intro.htm). One microplate (94 samples) for each SNP was genotyped by restriction digest as a check on the calls generated by KASPar and complete correspondence was found. Genotyping accuracy for all SNPs was assessed by inclusion of duplicates (pairs of monozygotic twins) in the arrays and negative controls (water blanks) on each plate. Primers and PCR conditions for SNP genotyping in the full cohort by Pyrosequencing are given in supplementary table B.
Selection of tSNPs and prediction
We used two approaches to identify an optimal subset of tSNPs as described by Stram et al16 and Chapman et al.15 The main difference is that tagsnps16 is based on the prediction of extended haplotypes (in this case based on 21 SNPs) from the marker haplotypes (in this case based on five tSNPs), whereas htSNP215 is based on the prediction of single SNP loci. Chapman et al’s15 method can also be used to predict the association of the ungenotyped SNPs with the trait, which can be useful for fine mapping. Furthermore, results of a multilocus test including all tSNPs is given, which provides a global or gene-wide significance level.22 Full details of these methods are given elsewhere.19
Association analyses
Association analyses in the Twin cohort were carried out using generalised estimating equations (GEE),22 which allows for the relatedness between twins and yields unbiased standard errors and p values. Each of the SNPs was analysed separately and followed up by haplotype analyses. For individual SNP association analyses, we first carried out a 2-df overall test of genotypic association. In the presence of a significant association, additive, dominant and recessive models (all 1 df) were further tested to find the best mode of inheritance. Age and menopausal status were included as covariates in the models. Details of our approach to test the association of statistically inferred haplotypes with continuous traits have been described previously.23 We adapted Zaykin et al’s24 haplotype trend regression for the analysis of related subjects, such as twins, by replacing the linear regression with the GEE procedure. The probabilities of haplotype pairs were estimated by PHASE V.2.0 software.25 Obesity-related variables included leptin, weight, body mass index, waist, total fat mass, % total fat, central fat mass and % central fat. Factor analysis was used to combine strongly correlated indices of obesity into two measures: one for general obesity (serum leptin, body mass index, weight, total fat mass and % total fat) and the other for central obesity (waist, central fat mass and % central fat). To reduce the likelihood of identifying false-positive associations, we analysed individual obesity-related variables only for those tSNPs showing significant results for at least one of the combined scores. We used two indices of insulin sensitivity: homeostasis model assessment (HOMA), based on fasting insulin and glucose data, and sensitivity insulin measure (SiM), based on both fasting and 2-h data, as described previously.26 Serum lipids included total cholesterol, LDL-cholesterol and HDL-cholesterol, triglycerides, and ApoA1 and ApoB.
Preliminary analyses were carried out using STATA V.8. Where needed, phenotypic variables were log transformed to obtain better approximations of the normal distribution before analysis. The Hardy–Weinberg equilibrium was tested by a χ2 test with 1 df in one twin of each pair chosen at random to prevent inflated significance. Pairwise linkage disequilibrium coefficients in the tSNP test sample were calculated using GOLD and reported as D′ and r2.27
RESULTS
SNP validation and tSNP selection
Of the 27 SNPs validated in the National Center for Biotechnology Information and Children’s Hospital Informatics Program Bioinformatics database populations that we tested in 16 subjects, four were not polymorphic (rs6671760, rs2051040, rs12749128 and rs2179761) and two occurred at frequencies of <6% (rs857155 and rs3738568). In all, 21 SNPs were polymorphic and were genotyped in 94 subjects for tSNP selection. Figure 1 shows the positions of these 21 SNPs. All were located in non-coding regions, and their genotype frequencies were consistent with Hardy–Weinberg proportions. The SNPs had MAFs >5% and showed strong pairwise linkage disequilibrium (supplementary table C). The presence of strong linkage disequilibrium throughout the gene suggested the feasibility of tSNP selection, facilitating great savings in time and costs.
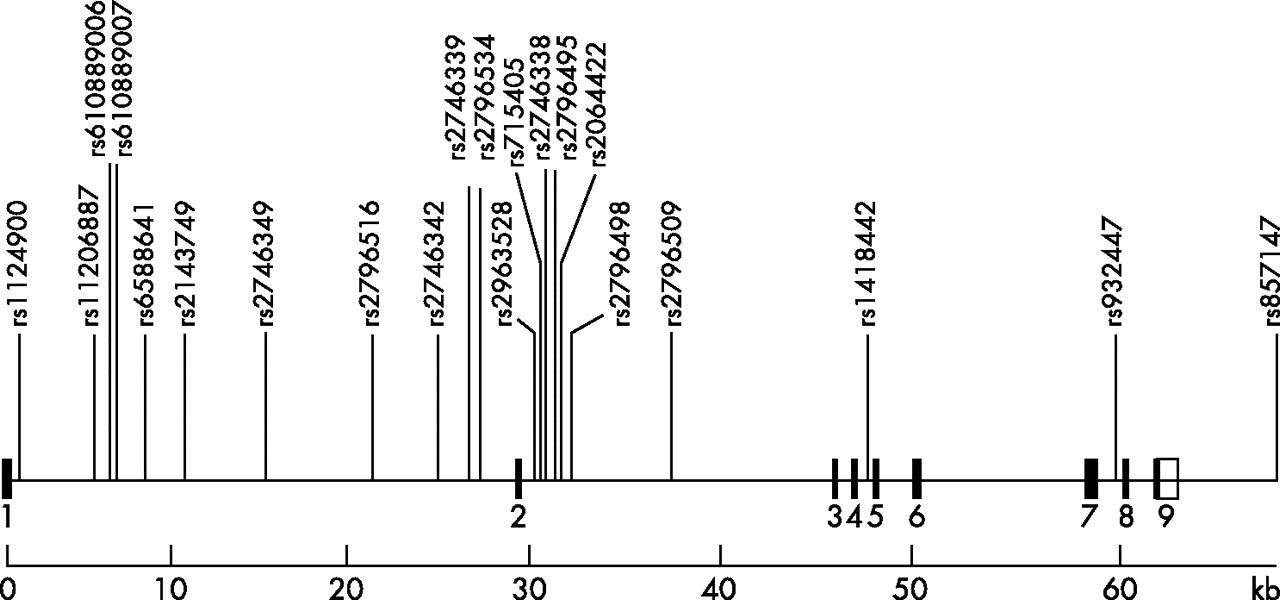
Genomic map of the PRKAA2 gene with locations of the 21 validated single-nucleotide polymorphisms genotyped in 94 subjects. Solid boxes, exons; open boxes, untranslated regions.
The inferred haplotypes of the 21 SNPs (n = 94) and tSNP selection based on haplotype prediction (RH2) and single SNP prediction (RL2) are shown in supplementary table D. Of the 14 haplotypes present, 2 were common (32.5% and 42.8%), 4 had a frequency of 2.4–7.9% and the remainder showed a frequency of ⩽1.2%. Five tSNPs (rs1124900, rs2796516, rs2746342, rs2796498 and rs1418442) were selected by htSNP215 based on single SNP prediction (RL2), with the criterion RL2⩾0.80, and by tagsnps16 based on haplotype prediction (RH2). This set of tSNPs accurately predicted both common haplotypes and unmeasured loci. The minimum value of RH2 was 0.93 (for haplotype 2) and that of RL2 was 0.90 (for rs11206887).
The genotype, allele and haplotype distributions of the five tSNPs in the whole cohort based on one monozygotic and both dizygotic twins genotyped for each pair are shown in supplementary table D. The total number of subjects genotyped for each polymorphism varied slightly and was somewhat lower than 2402, the total number of twins genotyped (ie, one monozygotic and both dizygotic twins of each pair). This was due to unsuccessful amplification of the target sequences for some samples. None of the loci showed deviation from the Hardy–Weinberg equilibrium. The same three most common haplotypes observed in the 94 subjects (supplementary table D) were also identified by the five tSNPs, although the actual estimates of haplotype frequencies and corresponding order varied somewhat between the full cohort and the tSNP selection sample (n = 94).
Tests of association of phenotypes with individual tSNP genotypes
Table 2 presents the results of individual SNP association analyses using GEEs.22 All SNPs were significantly associated with LDL-cholesterol and total cholesterol, with p values ranging from <0.001 to 0.034. The five tSNPs explained between 0.11% and 0.55% of variance in LDL-cholesterol, and between 0.13% and 0.59% of variance in total cholesterol. Additionally, rs1124900 was significantly associated with ApoB, rs2796516 with ApoB and serum triglyceride, and rs2796498 with HDL-cholesterol. For the combined central and general obesity scores, we observed a significant association only between rs2796516 and the central obesity score (p = 0.043). Follow-up analyses of the individual obesity variables for this SNP yielded significant associations with % total fat, % central fat and central fat mass (table 2).
Association of PRKAA2 tagging single-nucleotide polymorphisms with obesity-related phenotypes and lipid profile
Tests of association of phenotypes with tSNP haplotypes
Table 3 shows the frequencies for haplotypes of rs1124900–rs2796516–rs2746342–rs2796498–rs1418442 and results of haplotype association tests. Initially, we ran PHASE V.2.0 five times and used output from the run with the best average value for the goodness of fit. We also ran PHASE several times and found that the solutions in terms of haplotype frequencies were virtually identical for our data each time. Therefore, even the rarest two haplotype frequencies (2.3%) that we included in our haplotype analyses are meaningful. Also, because we have such a large sample size (n = 2254, 4508 haplotypes), a haplotype frequency of 2.3% still translates to about 104 haplotypes. Furthermore, we ran the haplotype analyses again after including the two rare haplotypes of 2.3% in the rest group, but results did not change. Haplotype probabilities were included in the analytical approach as described previously.23 Haplotype analyses showed results similar to those of the individual SNP associations, with haplotype 2 (frequency 34.7%) showing lower LDL-cholesterol and total serum cholesterol (p⩽0.001) compared with the most common haplotype 1 (frequency 45.7%). The β coefficient for haplotype 2 on LDL-cholesterol was −0.235 and on total cholesterol was −0.257—that is, LDL-cholesterol level was 0.235 mmol/l (0.21 SD) and total cholesterol level was 0.257 mmol/l (0.21 SD) lower for protective haplotype 2 homozygotes compared with common haplotype 1 homozygotes. The explained percentages of variance in LDL-cholesterol and total cholesterol by PRKAA2 haplotypes were 0.75% and 0.76%, respectively.
Association of PRKAA2 haplotypes (frequency>2%) with lipid profile
Haplotype 3 (frequency 10.5%) showed significantly lower HDL-cholesterol compared with common haplotype 1 (p = 0.005). HDL-cholesterol levels were 0.111 mmol/l (0.29 SD) lower for risk haplotype 3 homozygotes compared with common haplotype 1 homozygotes. The explained percentage of variance in HDL-cholesterol by PRKAA2 haplotypes was 0.59%. Overall p values of haplotype tests were significant for total-cholesterol (p = 0.002), LDL-cholesterol (p = 0.01) and HDL-cholesterol (p = 0.05).
Predictive associations with ungenotyped SNPs
The approach we used to select an optimal set of tSNPs15 can also predict which of those SNPs not typed in the full cohort might also show association with the trait. Figure 2 shows the fine mapping results (including the ungenotyped SNPs) based on prediction of single SNP loci from the five tSNPs genotyped in the Twins UK cohort. Associations of both tSNPs and predicted values for unmeasured SNPs with ApoB, HDL-cholesterol, LDL-cholesterol and total cholesterol under the additive genetic model are indicated by −10log (P). Except for three SNPs, the tSNP rs2796516 and the ungenotyped SNPs rs11206887 and rs10889007, consistent associations (all p<0.01) with LDL-cholesterol and total cholesterol levels were observed. For ApoB, a similar but weaker association pattern (all p<0.05) was observed. Predicted associations for body fat were found to be uninformative and are not shown. Multilocus (or gene-wide) tests, including all tSNPs, were significant for total cholesterol (p = 0.004) and LDL-cholesterol (p = 0.04).

Associations of tagging single-nucleotide polymorphisms (tSNPs) and predicted values for unmeasured SNPs and tSNPs with apolipoprotein (Apo)B, low-density lipoprotein (LDL)-cholesterol, high-density lipoprotein (HDL)-cholesterol and total cholesterol under the additive genetic model. Associations of tSNPs and predicted values for unmeasured SNPs with ApoB, LDL-cholesterol, HDL-cholesterol and total cholesterol under the additive genetic model are indicated by −10log (P). Points above the dotted line representing −10log 0.05 represent SNP associations found, or predicted to be significant at the p = 0.05 level.
DISCUSSION
AMPK is a metabolic “master switch”, phosphorylating key target proteins that control flux through metabolic pathways of hepatic ketogenesis, cholesterol synthesis, lipogenesis, triglyceride synthesis, adipocyte lipolysis and skeletal muscle fatty acid oxidation.3 We hypothesised that genetic variation in the AMPK α2 subunit gene PRKAA2 is associated with regulation of the lipid profile, affecting body fat deposition and sensitivity of target organs to insulin, potentially mediated by differential expression or activity of the AMPK α2 subunit. To this end, we have examined association of a set of five tSNPs spanning the AMPK catalytic α2 subunit gene PRKAA2, with a range of phenotypes representing body fat, insulin sensitivity and lipids. Minor associations were observed with ApoB, triglyceride, HDL-cholesterol and measures of body fat, and none with the insulin-sensitivity parameters. Therefore, in this study sample, common variation in PRKAA2 does not seem to be responsible for changes in effects on body weight through mediation of the anorexigenic effect of leptin by down regulation of AMPK in the hypothalamus,27 or for any associated effects on insulin sensitivity via stimulation of AMPK by leptin in muscle.28 However, all tSNPs were most strongly associated with LDL-cholesterol and total cholesterol (p<0.001 to 0.034). A protective haplotype 2 was identified, showing lower LDL-cholesterol and total serum cholesterol (p⩽0.001) compared with the most common haplotype 1. Importantly, global (ie, gene-wide) p values provided by both haplotype analyses and multilocus tests were significant for total cholesterol and LDL-cholesterol.
We have established these associations only in a sample of women, but our findings in these twin subjects can be considered as representative of the UK female population as a whole.18 We have previously found few differences between twins and singletons in the population generally, the only indication being that monozygotic twins had a slightly lower weight and a smaller variance for weight than dizygotic twins and singletons.18 This study had 80% (α = 0.05) power to detect a biallelic quantitative trait locus, explaining as little as 0.5% of the variance.
In a recent study, Sun et al10 tested the association of nine PRKAA2 tSNPs for association with type 2 diabetes in five different Caucasian samples, the largest of which comprised 1189 discordant sibs, and found no associations. They also tested glucose and insulin sensitivity in 756 controls without effect. In another study, Horikoshi et al11 tested association of six PRKAA2 tSNPs in 192 type 2 diabetes cases and 272 control Japanese samples and found no independent SNP associations, but they identified an associated haplotype, which was replicated in two other case–control studies. The minor allele of rs2051040, not among our tSNPs, was associated with the disease. The absence of single SNP associations found in all samples, with type 2 diabetes, insulin sensitivity or glucose, accords with our finding of absence of associations with insulin or glucose in 2771 normal Caucasian women. Neither Sun et al nor Horikoshi et al investigated the association with serum lipids.
Sun et al chose a set of tSNPs different from ours and from that of Horikoshi et al. Horikoshi et al included one of our tSNPs, rs1418442, in their set. There are several reasons for this, but as the gene lies in a region of high linkage disequilibrium, there is considerable diversity of choice in achieving equal coverage. Firstly, our tSNPs span 65.6 kb rather than the 100 kb tagged by Sun et al, which extends from 27 kb upstream of the transcription start site to 12 kb downstream of the 3′ untranslated region. Horikoshi et al included three new SNPs discovered by them, the total spanning from 1.4 kb upstream of the gene to the 3′ untranslated region. We selected no SNPs within the 1 kb region 5′ of the start site that we investigated, having failed to validate any in our test sample, and the last was approximately 5 kb 3′ of the gene. We chose a higher MAF (>6%) than either group considering the appropriate power to detect expected effects. Sun et al chose nine tSNPs from initially 73 db SNP candidates genotyped in the HapMap CEPH reference panel of 30 parent–offspring trios. Of these, 37 were retained and a further three candidates were added from the HapMap project. Hirokoshi et al genotyped 10 SNPs in 192 subjects and selected 6 tSNPs. We genotyped 27 dbSNP candidates in 96 unrelated people drawn from Twins UK and applied the methods of Chapman et al15 and Stram et al16 to select five tSNPs as described. We confirmed that our set of tSNPs cover all SNPs with MAF >6% in the CEPH genotype data of the Phase II HapMap (January 2006) release, with R2>95%; so our coverage of the PRKAA2 gene is as comprehensive as current data allow. In regions of high linkage disequilibrium such as this, we find that if Haploview/Tagger is run twice for the same region, using the same parameters, different tSNPs will be reported but coverage on both occasions remains almost the same. Hence, the tSNP sets chosen by the other groups and ourselves can be considered equal to the task of tagging common functional variants.
Strong linkage disequilibrium across the gene allowed us to effectively capture common variation by the selected set of tSNPs, making it unlikely that we may have missed any major variants that are either causal or in strong linkage disequilibrium with a causal locus. All of our associated tSNPs are intronic and are most likely to be linkage disequilibrium markers, although an increasing number of intronic regulatory variants are emerging. From our predictive analysis (fig 2), we showed fairly consistent association along the entire gene, with all but three SNPs providing signal. This is a consequence of strong linkage disequilibrium in the region and, although not providing informative fine-mapping peaks to identify functional alleles, this procedure does indicate a strong relationship between PRKAA2 variants and serum cholesterol levels. A rare functional variant with large effect is unlikely, because our tSNPs tag only common SNPs (MAF>6%) satisfactorily. A cis-interacting variant is possible, especially as the intronic SNPs could be regulatory.
HMG-CoA reductase, the rate-limiting enzyme of cholesterol synthesis,6 is a highly regulated enzyme. Phosphorylation and down regulation of its activity by AMPK4 and reversal by dephosphorylation mediated mainly by protein phosphatase 2A29 are responsible for rapid regulation of the enzyme’s activity. Recently, it has been found that cholesterol 7α-hydroxylase, the rate-limiting enzyme in the conversion of cholesterol to bile acids, is also phosphorylated and down regulated by AMPK in HepG2 cells.30 Thus, cholesterol synthesis and disposal are coregulated via the phosphorylation of key enzymes by AMPK.
The association between five individual PRKAA2 tSNPs and a haplotype with lower LDL-cholesterol and total serum cholesterol (p⩽0.001) suggests that genetic variation in PRKAA2 may influence the ability of AMPK to phosphorylate and down regulate HMG-CoA reductase. One possibility is that one or more variants responsible for more efficient phosphorylation and deactivation of the enzyme by AMPK could be found on the PRKAA2 haplotype 2 background. Identification of functional AMPK variants capable of reducing serum cholesterol levels could have potential therapeutic value.
REFERENCES
Supplementary materials
Files in this Data Supplement:
Footnotes
-
Funding: This study was funded by the British Heart Foundation Project grant number PG/04/028 and Wellcome Trust Project grant number 073142. The Twin Research and Genetic Epidemiology Unit received support from the Wellcome Trust, Arthritis Research Campaign, the Chronic Disease Research Foundation and the European Union 5th Framework Programme Genom EU twin number QLG2-CT-2002-01254.
-
Competing interests: None.
-
NJS-J and DG are joint first authors.
-
Published Online First 26 June 2006