Article Text

Abstract
Background Whole blood is currently the most common DNA source for whole-genome sequencing (WGS), but for studies requiring non-invasive collection, self-collection, greater sample stability or additional tissue references, saliva or buccal samples may be preferred. However, the relative quality of sequencing data and accuracy of genetic variant detection from blood-derived, saliva-derived and buccal-derived DNA need to be thoroughly investigated.
Methods Matched blood, saliva and buccal samples from four unrelated individuals were used to compare sequencing metrics and variant-detection accuracy among these DNA sources.
Results We observed significant differences among DNA sources for sequencing quality metrics such as percentage of reads aligned and mean read depth (p<0.05). Differences were negligible in the accuracy of detecting short insertions and deletions; however, the false positive rate for single nucleotide variation detection was slightly higher in some saliva and buccal samples. The sensitivity of copy number variant (CNV) detection was up to 25% higher in blood samples, depending on CNV size and type, and appeared to be worse in saliva and buccal samples with high bacterial concentration. We also show that methylation-based enrichment for eukaryotic DNA in saliva and buccal samples increased alignment rates but also reduced read-depth uniformity, hampering CNV detection.
Conclusion For WGS, we recommend using DNA extracted from blood rather than saliva or buccal swabs; if saliva or buccal samples are used, we recommend against using methylation-based eukaryotic DNA enrichment. All data used in this study are available for further open-science investigation.
- whole-genome sequencing
- dna source
- blood
- saliva
- buccal
This is an open access article distributed in accordance with the Creative Commons Attribution Non Commercial (CC BY-NC 4.0) license, which permits others to distribute, remix, adapt, build upon this work non-commercially, and license their derivative works on different terms, provided the original work is properly cited, appropriate credit is given, any changes made indicated, and the use is non-commercial. See: http://creativecommons.org/licenses/by-nc/4.0/.
Statistics from Altmetric.com
Introduction
Whole blood is the most common source of DNA for genetic analyses in both research and clinical settings. This is presumably for historical reasons—early studies of genetic disease used blood-derived DNA,1 and there exist established procedures and infrastructure for biochemical and metabolite testing in blood. However, blood collection can be problematic, especially for populations without access to phlebotomy centres and for individuals unwilling or unable to give blood.2 Alternative sources of DNA include saliva and buccal (cheek) cells, which are becoming increasingly popular due to ease of collection (including being non-invasive and amenable to self-collection) and better stability for shipping and storage.2 3
Whole-genome sequencing (WGS) is gradually replacing whole-exome sequencing and chromosomal microarray analysis (CMA) for genetic variant detection, since WGS can detect all sizes and types of variants with base-pair resolution in one experiment. However, in order for WGS to achieve the broadest possible impact across precision medicine4 5 and general biology,6 7 a better understanding of the impact of DNA source is required. Despite their advantages, saliva and buccal samples will not become equally accepted DNA sources for WGS until all classes of genetic variation can be detected from them as accurately as from blood samples.
Previous studies have compared genetic variant detection from blood-derived DNA to that of DNA isolated from saliva or buccal samples. Most reported no difference in accuracy,8–19 although some favoured blood-derived DNA20–22 (online supplementary table 1; all supplementary tables and figures are in online supplementary file 1). However, all but one of these studies used CMA, so their applicability to WGS is unclear. Further, although all prior studies examined single nucleotide polymorphisms (SNPs; single-base substitutions of moderate-to-high population frequency), few assessed copy number variants (CNVs), none examined short insertions/deletions (indels) and just one (the sole WGS study11) assessed single nucleotide variants (SNVs; single-base substitutions of any frequency) (online supplementary table 1).
Supplemental material
Here, we performed a comprehensive assessment of the impact of DNA source using industry-standard short-read WGS data. Our systematic study design investigated how DNA source and bacterial DNA contamination affect the quality of sequencing data and the accuracy of SNV, indel, and CNV detection. We also investigated a methylation-selection method for reducing bacterial DNA contamination in saliva and buccal samples prior to sequencing.23 All samples and data were from Personal Genome Project Canada (PGPC)24 participants, who consented for open sharing.
Methods
From each of four individuals who had previously provided blood samples for the PGPC study,24 we collected three saliva samples and three buccal samples (all on different days). Online supplementary table 2 indicates the age of each participant at sample collection. We quantified bacterial DNA for each sample and selected one saliva and one buccal sample per individual for further analysis. DNA library preparation (PCR-free) and sequencing (Illumina HiSeq X) were performed for each blood sample, as well as for each selected saliva and buccal sample either with or without prior methylation-based enrichment for eukaryotic DNA. (Generally, eukaryotic DNA is methylated but microbial DNA is not, allowing separation based on methylation status.23) SNVs and indels were detected using the Genome Analysis Toolkit,25 and CNVs were detected using ERDS26 and CNVnator27 as previously described.28 We then identified differences in sequencing metrics and variant-detection accuracy among the sample types. As a baseline for variant-detection concordance, we used a previously generated sequencing data set from HuRef blood-derived DNA,28 as well as a second replicate from the same DNA extraction prepared and sequenced specifically for this study. Although this study is largely descriptive, when appropriate we used statistical tests tailored to small sample sizes. The online supplementary file 2 contains full details on DNA extraction, bacterial DNA quantification, eukaryotic DNA enrichment, DNA library preparation and sequencing, variant detection and statistical analysis.
Supplemental material
Results
Bacterial DNA quantification
From each of four study participants, denoted PGPC-0002, PGPC-0005, PGPC-0006 and PGPC-0050, we collected one blood sample, three saliva samples and three buccal samples and quantified their relative concentrations of human and bacterial DNA. As expected, the blood samples contained little bacterial DNA (online supplementary figure 1). Generally, there was substantially more bacterial DNA in saliva than in buccal samples, and its concentration varied more in saliva samples both among and within individuals. For further analysis, we selected one saliva and one buccal sample per individual, representing a range of bacterial DNA concentrations (online supplementary figure 1). Five WGS data sets were generated per individual, derived from blood, saliva without eukaryotic DNA enrichment, saliva with enrichment, buccal without enrichment and buccal with enrichment (figure 1). The WGS data sets were then evaluated for general WGS and alignment characteristics and variant-detection concordance and accuracy.

Study design. From each of four individuals, three sources of DNA were collected (blood, saliva and buccal). Five DNA libraries were prepared per individual—blood, saliva without eukaryotic DNA enrichment, saliva with enrichment, buccal without enrichment and buccal with enrichment. Whole-genome sequencing and genetic variant detection were performed for the 20 DNA libraries, which were compared with one another to determine the impact of DNA source and eukaryotic DNA enrichment on sequencing data quality and variant detection. B_NE, non-enriched buccal; B_WE, enriched buccal; S_NE, non-enriched saliva; S_WE, enriched saliva.
General WGS and alignment characteristics
Statistically significant differences among blood, non-enriched saliva and non-enriched buccal samples were observed for several sequencing metrics (Friedman repeated-measures test, followed by Conover-Iman tests to assess pairwise differences). For example, the percentage of reads successfully aligned to the human reference genome was significantly higher in blood samples (99.8% ± 0.1%) than in non-enriched saliva samples (85.3% ± 10.7%; p=0.000 for mean different from blood) and non-enriched buccal samples (98.4% ± 0.7%; p=0.005) (online supplementary tables 3-4). Blood samples also had significantly lower percentages of alignments <50 bp (typical of bacterial DNA), higher mean sequencing depths and lower mean mitochondrial sequencing depths. The percentage of alignments <50 bp was significantly lower in enriched saliva (0.6% ± 0.5%) and buccal (0.1% ± 0.0%) samples than in non-enriched saliva (4.8% ± 4.3%) and buccal (0.4% ± 0.2%) samples (Wilcoxon signed-rank test p=0.062 for both saliva and buccal), suggesting that enrichment successfully removed bacterial DNA (online supplementary tables 3-4). Compared with their non-enriched counterparts, the enriched saliva and buccal samples also had significantly higher percentages of aligned reads, higher percentages of genomic positions sequenced to >40× depth and lower mean mitochondrial sequencing depths. Enriched saliva samples also had significantly higher mean genome-wide sequencing depths and higher percentages of genomic positions sequenced to >30× depth than non-enriched saliva samples. Enriched samples exhibited lower read-depth uniformity, particularly for buccal (online supplementary table 3 and online supplementary figure 2).
To determine whether differing bacterial DNA concentrations were driving these observations, we plotted bacterial DNA concentration against each sequencing metric. When non-enriched, the two samples with the highest bacterial DNA concentrations (both saliva; online supplementary figure 1) had the highest percentages of aligned sequences <50 bp and the lowest values for percentage of reads aligned, mean mapping quality, median insert size, mean genome-wide read depth and percentage of genomic positions sequenced to >40× depth (figure 2). When the same samples were enriched, the values of these metrics approached those of the samples with lower bacterial DNA concentrations. Enrichment had a material impact on these sequencing metrics only for samples with high bacterial DNA concentrations.
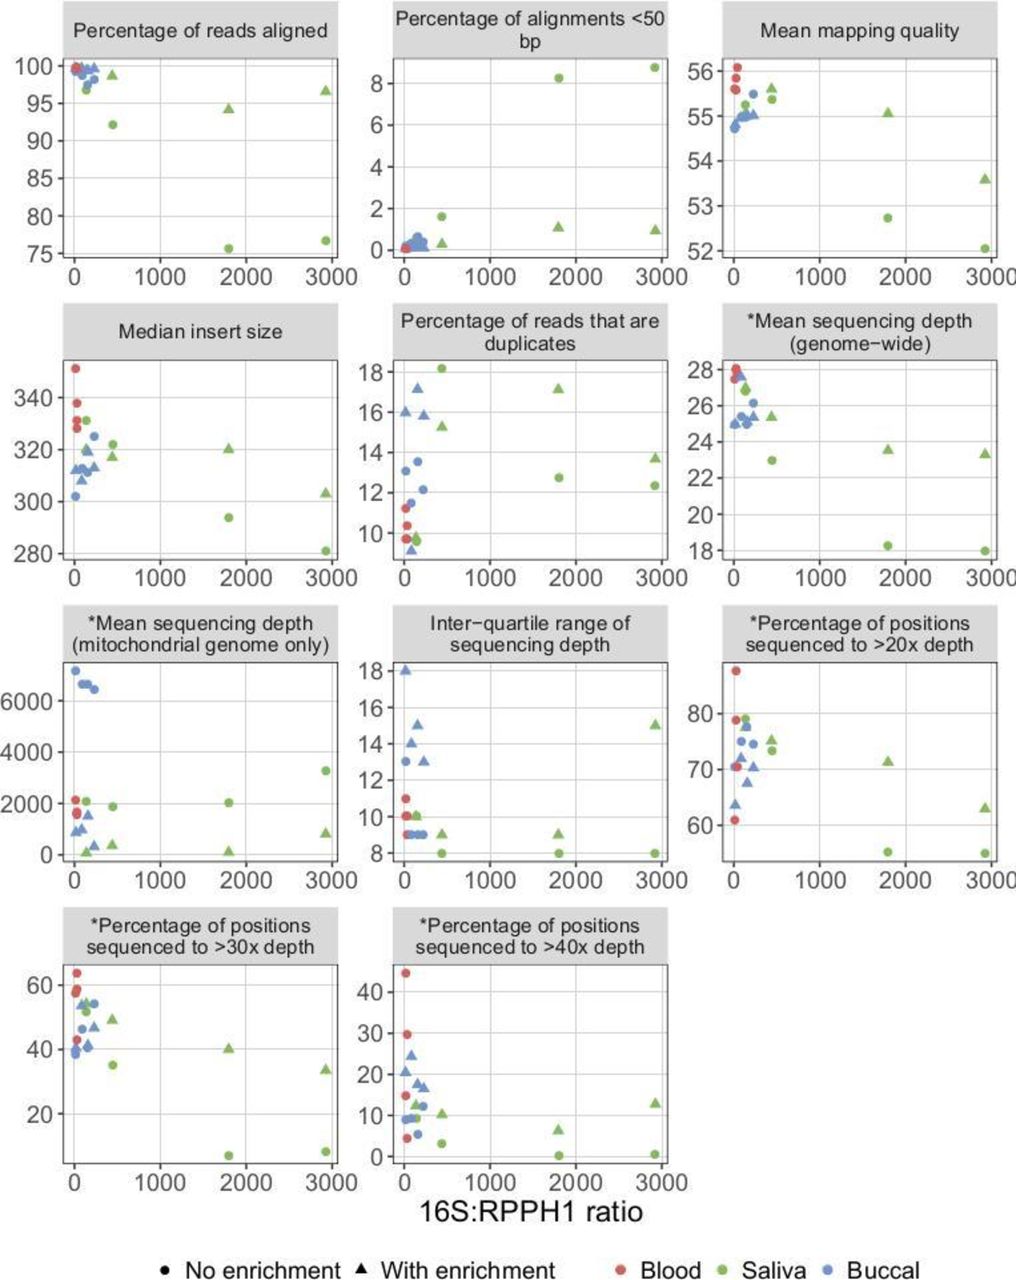
Relationship between bacterial DNA concentration and sequencing metrics. Higher 16S:RPPH1 ratios indicate higher bacterial DNA concentrations. Metrics prefixed with an asterisk were corrected for the total number of reads in a given sample. For saliva and buccal samples, the same sample is shown for sequencing data generated either with or without prior enrichment for eukaryotic DNA. For example, when the saliva sample with 16S:RPPH1 ratio ~2900 (online supplementary figure 1) was sequenced without first performing eukaryotic DNA enrichment, approximately 77% of reads aligned (top-left scatterplot), versus 97% when eukaryotic DNA enrichment was performed. Higher values for the inter-quartile range of sequencing depth indicate lower read-depth uniformity.
To determine their sources, we used BLAST to search 10 000 unmapped reads from each sample against the National Center for Biotechnology Information (NCBI) nucleotide database (online supplementary table 5). As expected, the percentage of unmapped reads matching bacteria was highest in the non-enriched saliva and buccal samples, lower in the corresponding enriched samples, and nearly zero in the blood samples. Most unmapped reads from blood matched eukaryotes, suggesting that sequencing errors may explain why they were unmapped. The percentage of unmapped reads in a given sample that matched bacteria was positively correlated with their mean base-quality score (online supplementary table 5), suggesting that unmapped reads not matching bacteria were more likely to arise from sequencing errors.
Impact of DNA source and eukaryotic DNA enrichment on SNV and indel detection
To eliminate mean sequencing depth as a confounding variable, reads were subsampled prior to variant detection to give each sample approximately the same mean depth as the lowest-depth sample (25×). To begin comparing SNV and indel detection among the five sample types, we computed variant counts and allele fraction distributions for each sample. After filtering, counts of known variants (those in the Genome Aggregation Database (gnomAD)29) ranged between 3 530 091 and 3 674 442 for SNVs and between 218 964 and 226 099 for indels; counts for novel variants (those absent from gnomAD) ranged between 20 072 and 58 060 for SNVs and between 2950 and 4223 for indels (online supplementary table 6). No statistically significant differences were observed among the five sample types in terms of the number of variants detected in each category (known SNVs, novel SNVs, known indels and novel indels) (Friedman repeated-measures test for blood, non-enriched saliva and non-enriched buccal samples or Wilcoxon signed-rank test for enriched vs non-enriched saliva or buccal samples). Allele fraction distributions did not differ with sample type (online supplementary figure 3 and online supplementary table 7).
Next, we compared blood-derived DNA with DNA from non-enriched saliva and buccal samples in terms of SNV and indel detection. As a baseline for variant-detection concordance when DNA library preparation and sequencing were performed twice for the same individual and DNA source, we used two replicates from a blood-derived HuRef sample. Concordance between blood samples and non-enriched saliva or buccal samples was similar to the baseline concordance for both SNVs and indels (table 1 and online supplementary file 3). (The HuRef blood-derived DNA replicates were sequenced nearly 3 years apart, so batch effects may explain why they did not exhibit greater concordance with each other than observed between different DNA sources.) Except for novel SNVs, concordance was similar when comparisons were restricted to coding exons, all exons, introns or intergenic regions (online supplementary tables 8-9). Compared with exons, concordance was lower in introns and intergenic regions, where increased repetitive and low-complexity elements complicate variant detection. To evaluate the accuracy of discordant variants, we used Integrative Genomics Viewer (IGV) to visually inspect read alignments for 100 SNVs and 100 indels that were detected in a blood sample but not in the corresponding non-enriched saliva or buccal sample or vice versa (online supplementary file 4). A variant was deemed false if it had little supporting evidence, if many supporting reads had poor mapping quality or were soft clipped, or if reads from one strand predominated (online supplementary figure 4). We observed no statistically significant difference in accuracy (χ2 test) between variants detected only in blood samples and variants detected only in non-enriched saliva or buccal samples (online supplementary table 10).
Supplemental material
Supplemental material
SNV- and indel-detection concordance between blood samples and non-enriched saliva or buccal samples and between enriched saliva or buccal samples and the corresponding non-enriched samples, for filtered variants detected anywhere in the genome.
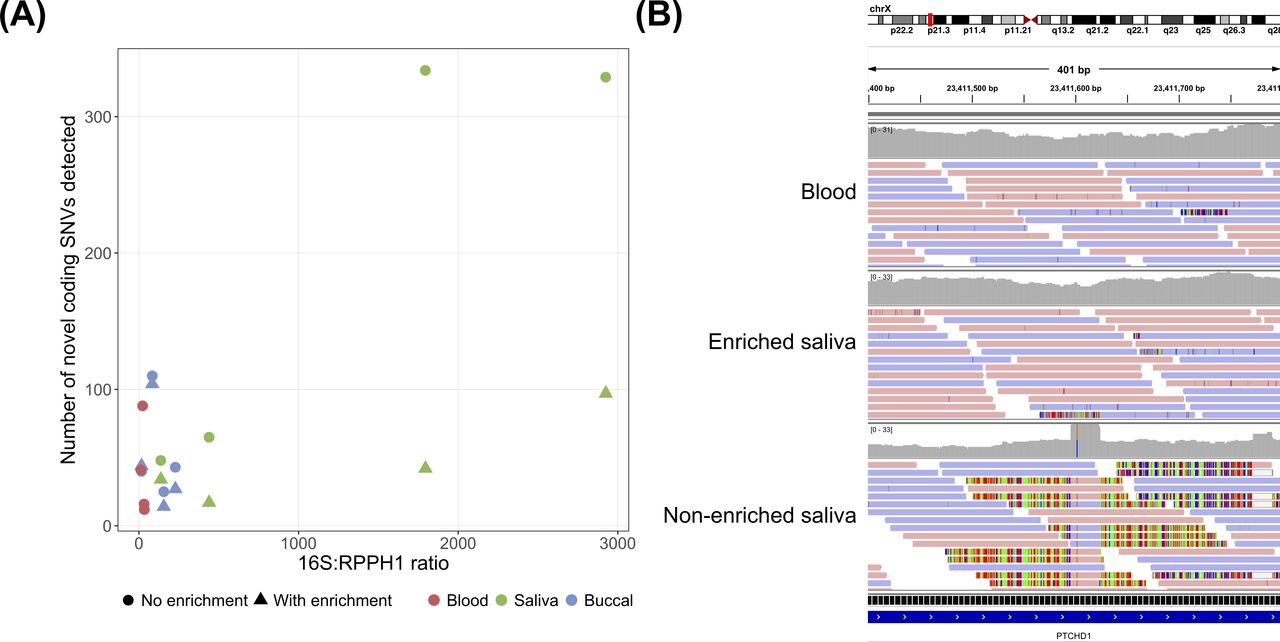
Although not statistically significant, several non-enriched saliva and buccal samples had substantially more novel SNVs than the corresponding blood sample (table 1 and online supplementary table 6). The majority of discordant novel SNVs were false (online supplementary table 10), suggesting that some saliva and buccal samples had higher false positive rates (FPRs) for SNVs. Since known SNVs outnumbered novel SNVs by approximately 100:1 (online supplementary table 6), this difference in FPR is negligible for SNVs as a whole. However, when identifying genetic associations with disease, rare variants (eg,<1% population frequency) are often of interest. As only a small percentage of variants detected in an individual are rare, the increased FPR for novel SNVs in some saliva and buccal samples is more consequential for rare variants. Coding exons exhibited the largest differences in the number of novel SNVs detected (online supplementary table 9); aggregating over the individuals, 157 novel coding SNVs were detected in blood samples, 218 in non-enriched buccal samples and 776 in non-enriched saliva samples. We detected substantially more novel coding SNVs in non-enriched samples with high bacterial concentrations than in the corresponding enriched samples or in non-enriched samples with low bacterial concentrations (figure 3A). We visualised alignments for 15 novel coding SNVs detected in each individual’s non-enriched saliva sample but not the corresponding blood sample, and nearly all appeared to be false variants caused by the alignment of short segments of bacteria-derived reads (figure 3B and online supplementary file 4).
Bacterial contamination and the detection of false single nucleotide variants (SNVs). (A) Relationship between bacterial DNA concentration and the number of novel coding SNVs detected in each sample. For further details, see figure 2. (B) Integrative Genomics Viewer read pile-up showing a false SNV in an exon of PTCHD1 detected in the non-enriched saliva sample from individual PGPC-0050, but not in the enriched saliva sample or blood sample from the same individual. The false SNV was detected because many short segments of bacterial reads containing a sequence difference relative to the human reference genome aligned to this region. A BLAST search suggested that the aligned bacterial reads were derived from the genome of Fusobacterium periodonticum (99% query cover, 97% identity), a bacterium known to be found in the human oral cavity.45
We also examined the concordance of SNV and indel detection between the matched enriched and non-enriched saliva samples, and likewise for buccal samples. For both DNA sources, concordance for both SNVs and indels was similar to that of the HuRef blood replicates (table 1). Visual inspection of read alignments revealed no statistically significant difference in accuracy (χ2 test) between variants detected only in enriched samples and those detected only in non-enriched samples (online supplementary table 10). In aggregate, substantially more novel SNVs were detected only in non-enriched samples than only in enriched samples (table 1), mirroring the comparison between blood samples and non-enriched saliva or buccal samples.
To assess sensitivity for clinically relevant variants in the four study participants, we examined 127 SNVs and 15 indels that were previously determined to be of potential clinical interest.24 Every SNV except one was detected in all five sample types (online supplementary file 5). Eleven of the 15 indels were detected in every sample type; the remaining four were each missed in a single sample type (one in each type).
Supplemental material
Finally, we assessed the impact of the differences in mitochondrial read depth among the sample types (figure 2 and online supplementary table 3) on SNV and indel detection in the mitochondrial genome. The enriched saliva samples from PGPC-0002 and PGPC-0005, which had by far the lowest mitochondrial read depths, contained two clusters of apparent SNVs, each nearly identical in the two samples, that were absent from the blood and non-enriched saliva samples from the same individuals and from the enriched saliva samples from PGPC-0006 and PGPC-0050 (online supplementary figure 5). Reads supporting these SNVs were found in all 20 samples, but comprised a much greater proportion of the reads mapping to those positions in the enriched saliva samples from PGPC-0002 and PGPC-0005 (online supplementary table 11). Reads containing these SNVs are likely derived from nuclear mitochondrial insertions,30 31 which would explain why the numbers of reads supporting the alternate alleles were similar across samples regardless of mitochondrial read depth. The reduced mitochondrial read depth in the enriched samples may also affect heteroplasmy detection: fractions could be skewed, and low-level heteroplasmy missed altogether.
Summary of the impact of DNA source and eukaryotic DNA enrichment on the accuracy of genetic variant detection from whole-genome sequencing data.
Overall, DNA source and eukaryotic DNA enrichment had a minor impact on the detection of small variants. Differences included the higher FPR for novel (especially coding) SNVs in some non-enriched saliva and buccal samples and the false mitochondrial SNVs detected in enriched samples (table 2).
Impact of DNA source and eukaryotic DNA enrichment on CNV detection
CNVs were detected using our validated workflow28 involving the read depth-based algorithms ERDS26 and CNVnator.27 The number of CNVs detected differed with sample type (online supplementary table 12); in particular, the number of common CNVs (those with >1% population frequency32) detected in blood was typically higher than in the other sample types and lower in the enriched buccal samples.
To compare CNV detection in blood samples with that in non-enriched saliva and buccal samples, we enumerated CNVs detected concordantly or discordantly between the blood sample and the non-enriched saliva or buccal sample from the same individual. This was done for both common (table 3) and rare (online supplementary table 13) CNVs. We visually inspected alignments using IGV28 to assess the accuracy of all discordant rare CNVs and a subset of discordant common CNVs (online supplementary file 6). Compared with the non-enriched saliva and buccal samples, CNV detection was more sensitive in blood-derived DNA, with the magnitude of the effect dependent on CNV size and type. Among the four individuals, we detected 463 common deletions between 1 and 5 kb in both blood and non-enriched saliva, 244 only in blood and 117 only in non-enriched saliva (table 3), giving a ratio of (463+244)/(463+117)=1.22 (ie, blood was 22% more sensitive than non-enriched saliva). Similarly, 25% more deletions between 1 and 5 kb were detected in blood samples than in non-enriched buccal samples. Because nearly all discordant deletions were deemed correct by visual confirmation (table 3), these disparities in the number of detected deletions constitute real sensitivity differences. For deletions between 5 and 10 kb, sensitivity in blood samples was 21% and 10% higher than in non-enriched saliva or buccal samples, respectively. Little difference was observed for deletions >10 kb. The advantage of blood samples over non-enriched saliva or buccal samples was more modest for duplications: sensitivity was 14% and 4% greater for common duplications between 1 and 5 kb, 19% and 7% greater for those between 5 and 10 kb, and nearly identical for those >10 kb. Variations among individuals generally resulted in there being no statistically significant differences in the number of deletions detected among blood, non-enriched saliva and non-enriched buccal samples (Friedman repeated-measures test; online supplementary table 14); the aggregate differences described above appear to be driven by high bacterial content in certain samples, particularly saliva (online supplementary figure 1 and online supplementary file 3).
Supplemental material
Concordance between blood samples and non-enriched saliva or buccal samples and between enriched saliva or buccal samples and the corresponding non-enriched samples, for common CNVs (those with >1% frequency in MSSNG parents32).
With respect to FPRs, little difference was observed between blood samples and non-enriched saliva or buccal samples for deletions. FPRs for duplications were higher overall than for deletions, reflecting the greater difficulty of duplication detection, but were higher in non-enriched saliva and buccal samples. In particular, all rare duplications detected in non-enriched saliva or buccal samples but not in blood samples were false (online supplementary table 13).
To investigate the effect of eukaryotic DNA enrichment on CNV detection, we enumerated CNVs detected concordantly or discordantly in the enriched and non-enriched saliva samples from a given individual (and likewise for buccal). Sensitivity for both deletions and duplications was generally better in the non-enriched than in the enriched samples, particularly for buccal, for which the effect was statistically significant (Wilcoxon signed-rank test; table 3 and online supplementary table 14). Visual inspection of alignments revealed that non-uniform read depth likely explained some of the deletions missed in the enriched samples (online supplementary figure 6A), whereas others were difficult to explain (online supplementary figure 6B). For buccal samples, the FPR for large deletions was higher in enriched samples than in non-enriched (table 3 and online supplementary table 13), likely due to less uniform read depth—a trend also evident (but less pronounced) in saliva samples (online supplementary figure 6C). Poor read-depth uniformity can cause the detection of false CNVs when using PCR-based DNA library preparation,28 and methylation-based eukaryotic DNA enrichment appeared to produce an analogous effect. FPRs for duplications were higher in enriched than in non-enriched samples, again likely due to lower read-depth uniformity (online supplementary figure 6D); in particular, none of the rare duplications unique to the enriched samples appeared correct (online supplementary table 13).
To confirm that these differences in CNV-detection accuracy were not specific to our ERDS and CNVnator-based workflow, we detected CNVs using an alternative workflow based on Canvas.33 Specifically, we determined the fraction of CNVs detected by Canvas in a given individual and sample type that were also detected by our standard CNV-detection workflow in the blood sample from the same individual. Blood samples were used for comparison because blood was the most accurate sample type for our standard workflow. The two approaches generally yielded consistent results: CNV detection was more sensitive in non-enriched saliva or buccal samples compared with enriched, and sensitivity in blood samples was higher than in non-enriched buccal samples (although blood and non-enriched saliva samples had similar sensitivity with Canvas) (online supplementary table 15).
Overall, DNA source and eukaryotic DNA enrichment had a more substantial impact on the read depth-based detection of CNVs than they did on small variants, with higher accuracy in blood samples than in non-enriched saliva or buccal samples and higher accuracy in non-enriched than in enriched samples (table 2).
Impact of DNA source and eukaryotic DNA enrichment on structural variation (SV) detection
In this study, we concentrated on SNVs, indels and CNVs, as there exist fully established workflows for their detection.25 28 34 As a preliminary investigation into the effect of sample type on SV detection, we employed Manta,35 which uses anomalously mapped paired-end reads and soft-clipped reads to detect SVs. Specifically, we enumerated SVs of each type (deletions, duplications, inversions, insertions and breakends) detected by Manta in each sample as a crude measure of sensitivity. For comparison with the read-depth results, deletion and duplication counts were stratified by size. In general, more deletions and duplications were detected in blood samples than in the other sample types, although the magnitudes of the differences were generally small and varied by size (online supplementary table 16). The small differences in apparent sensitivity among sample types suggest that methods based on anomalously mapped paired-end reads and soft-clipped reads may be able to partially compensate for the reduced sensitivity of deletion and duplication detection observed in the non-blood sample types when using read depth-based approaches. For other SV types, more variants were detected in the blood sample than in any of the other sample types in 3/4 individuals for inversions, 0/4 for insertions and 2/4 for breakends. Once reliable, validated workflows for SV detection have been established, we will more thoroughly investigate the effect of DNA source and eukaryotic DNA enrichment using the same methodology employed for SNVs, indels and CNVs.
Discussion
In the design and implementation of our own WGS studies32 36 37 and in running a service-based sequencing centre, questions often arise about whether saliva- or buccal-collection kits yield DNA sufficient for comprehensive WGS and genetic variant detection, and how these data compare with those from the current gold standard (blood-derived DNA). To investigate the impact of DNA source for researchers and clinicians, five sample types—blood, saliva with or without methylation-based eukaryotic DNA enrichment, and buccal swabs with or without enrichment—were sequenced from each of four individuals. Blood consistently gave the best sequencing metrics, and although enrichment of saliva or buccal samples decreased the percentage of unmapped reads and short, spurious alignments, it also reduced read-depth uniformity and mitochondrial read depth. Consistent with Wall et al,11 DNA source had little effect on the accuracy of SNV detection, although we found that the FPR for rare SNVs was higher in some non-enriched saliva and buccal samples. However, DNA source appeared to affect the accuracy of read depth-based CNV detection—sensitivity for deletions and duplications was higher in blood samples than in non-enriched saliva or buccal samples, and the FPR for duplications was lower in blood samples. Eukaryotic DNA enrichment hampered read depth-based CNV discovery, with non-enriched samples giving better sensitivity for deletions and duplications and a lower FPR for duplications. The reduced accuracy of read depth-based CNV detection in enriched samples was likely due to lower read-depth uniformity, which may result from non-uniform methylation causing some genomic regions to be captured more efficiently than others.38 39 In this study, the sequencing data were subsampled to eliminate read depth as a confounding factor when evaluating variant-detection accuracy. Had this step been omitted, we might have observed larger differences among sample types, especially for samples with high bacterial concentrations. This possibility is supported by our previous study, in which sensitivity for detecting deletions<10 kb decreased when the mean read depth was less than ~30×.28
Besides variant-detection accuracy, other considerations may be important when choosing a DNA source. Blood is collected by a professional phlebotomist, leaving little risk of improper collection. For saliva or buccal samples, participants may provide too little material, especially when self-collected, or may ignore instructions to refrain from eating. However, blood can be difficult to collect from individuals who fear needles and from children with behavioural difficulties or sensitivity to touch or pressure. Saliva and buccal samples are more stable than blood samples, can be collected in the participant’s home (for research purposes) and can be shipped more easily. In clinical diagnostics, additional factors may influence the choice of DNA source. For instance, certain neurodevelopmental and neurological disorders have causative variants specific to, or more evident in, certain sample types, such as ectodermal-derived tissues (which include buccal cells).40–42 When detecting somatic mutations in patients with leukaemia, blood cannot be used as a matched normal sample. For mitochondrial variants, heteroplasmy can vary across tissue types.43 If saliva or buccal samples are preferred given these considerations, then we recommend against methylation-based eukaryotic DNA enrichment, as the advantages of enrichment appear negligible and are outweighed by the drawbacks noted above. By aligning against the human reference genome, most bacterial reads are removed automatically. Increases in read depth with enrichment were modest; the same increase could be achieved via additional sequencing—an option that will become even more appealing as sequencing costs continue to decline.
Unless saliva or buccal samples are preferred for reasons such as those outlined above, we recommend using DNA derived from blood samples for WGS, as it equalled or surpassed saliva and buccal samples (although often only slightly) for all comparisons performed in this study. As more WGS data sets are generated, the ability to accurately detect genetic variants of all types will be critically important for population genetics studies, disease studies and clinical diagnostics. Large-scale meta-analyses will become increasingly valuable; however, a significant challenge is data heterogeneity, which can originate from differences in DNA library preparation, sequencing platform, read depth, etc. Although methods exist for addressing heterogeneity,44 it is undoubtedly beneficial to remove its sources in advance. Given that differing DNA sources add heterogeneity, and that whole-blood samples appear to be better than saliva and buccal samples for WGS, continued use of blood as the first-line tissue source would facilitate accurate, large-scale comparative analyses of WGS data.
Acknowledgments
We thank Janet Buchanan and Richard Wintle for critical feedback on the manuscript; Jo-Anne Herbrick, Jennifer Howe and Barbara Kellam for helpful discussions and Zhuozhi Wang for helping deposit the sequencing data to NCBI.
References
Footnotes
Contributors BT, SW and SWS designed the study. SW and MJZ managed ethics approval and sample collection. BT, SW, SAH, WWLS, SP, CLP, EJH, LJS, CN, AR and CRM analysed the data. BT and SWS supervised the study and wrote the manuscript. All authors have read and approved the final manuscript.
Funding BT is funded by the Canadian Institutes of Health Research (CIHR) Banting Postdoctoral Fellowship. SWS is funded by the GlaxoSmithKline-CIHR Chair in Genome Sciences at the University of Toronto and The Hospital for Sick Children. Technology development funds for this research were used from grants from Genome Canada, the University of Toronto McLaughlin Centre, and The Hospital for Sick Children Foundation. The sequencing and informatics infrastructure was supported by the Canada Foundation for Innovation.
Competing interests None declared.
Ethics approval This study was approved by the Research Ethics Board (REB) at The Hospital for Sick Children (REB no. 1000053640).
Provenance and peer review Not commissioned; externally peer reviewed.
Data availability statement Data are available in a public, open access repository.