Article Text

Abstract
Background: Chromosomal imbalances are a major cause of developmental defects as well as cancer and often constitute the key in identification of novel disease related genes. Classical cytogenetic methods are limited in resolution and dependent on highly skilled labour, while methods with higher resolution, based on molecular cytogenetics approaches such as matrix CGH, are not widely available.
Methods: We have developed and evaluated a method we term “molecular karyotyping”, using readily available and easy to handle oligonucleotide arrays originally designed for parallel genomewide analysis of over 10 000 SNPs. We show that we can easily and reliably detect unbalanced chromosomal aberrations of various sizes from as little as 250 ng of DNA on a single microarray, based on fluorescence intensity information from clusters of SNPs.
Results: We determined the resolution of this method through analysis of 20 trios with 21 previously confirmed subtle aberrations sizing between 0.2 and 13 Mb. Duplications and deletions of at least 5 Mb in size were reliably detectable, but detection of smaller aberrations was dependent on the number of SNPs they contained, thus seven of 10 different deletions analysed, with sizes ranging from 0.2 to 3.7 Mb, were not detectable due to insufficient SNP densitiy in the respective region.
Conclusions: Deduction of reliable cut off levels for array peaks in our series of well characterised patients allows the use of the GeneChip Mapping 10K SNP array for performing rapid molecular karyotyping from small amounts of DNA for the detection of even subtle deletions and duplications with high sensitivity and specificity.
- genomewide SNP array
- microdeletions
- microduplications
- molecular karyotying
Statistics from Altmetric.com
Chromosomal imbalances are a major cause of developmental defects and of cancer, and are often key to identification of novel disease related genes. However, the detection of smaller deletions or duplications is hampered by the limited resolution of conventional karyotyping. To overcome these limits, efforts have been made in recent years to develop screening methods with different techniques such as fluorescent in situ hybridisation (FISH)1, loss of heterozygosity (LOH) analysis with microsatellite markers,2 multiplex amplifiable probe hybridisation,3 or multiplex ligation dependent probe amplification.4 Because these methods are labour intensive, they are mostly restricted to subtelomeric regions, in which the high gene content and recombination rate promises a significant rate of aberrations. Although matrix comparative genomic hybridisation (CGH) on probe arrays has recently been shown to have the potential to detect trisomies as well as subtle aberrations not visible by standard techniques, high resolution arrays are not widely available.5–9 The readily available GeneChip Mapping 10K SNP array was recently shown to allow detection of homozygous deletions, amplifications, and copy number reductions of regions ⩾10 Mb in polyploid cells from tumour cell lines, using genotypes in combination with copy number information from hybridisation intensities.10 Although single SNP resolution can be obtained in tumours with SNPs that are homozygously deleted or amplified greater than approximately fivefold, germline deletions and duplications are more difficult to detect with high statistical confidence, owing to their 1:2 and 2:3 ratios, respectively. Therefore, we evaluated if the GeneChip Mapping 10K array could also be used for high resolution karyotyping of germline aberrations, by blindly analysing 20 individuals with 21 previously characterised subtle aberrations and their parents.
MATERIAL AND METHODS
Patients
DNA from 20 patients with well characterised multiple congenital anomalies–mental retardation syndromes (such as Angelman, ATR-16, DiGeorge, Leri-Weill, Miller-Dieker, Mowat-Wilson, Smith-Magenis, Williams-Beuren, and Wolf-Hirschhorn syndromes), harbouring 17 cryptic chromosomal deletions, one double deletion (patient P20), one unbalanced translocation (patient P5), and one monogenic disorder (patient P6, negative control), and from their parents was extracted from peripheral blood via a standard salt precipitation method. All patients had at least one normal routine karyotyping. Six deletions were detected by an experienced cytogeneticist (UT) via conventional chromosomal analysis at approximately 500 bands resolution, while 10 deletions were only demonstrated by specific FISH analysis after clinical suspicion. Two deletions and one unbalanced reciprocal translocation were identified by FISH screening of subtelomeric regions using the new generation panel as described by Knight et al.11 Larger deletions were approximately sized via high resolution GTG banding, while smaller deletion sizes were determined by FISH with locus specific probes and microsatellite markers as described elsewhere for deletions 1p36.3,12 2q22,13 4p16.3,14 5q35.3,15 7q11.23,16 and 22q11.217 (table 1). To avoid biasing of results, we included all available families with different microaberrations who gave their consent to participate, without selection for SNP coverage of respective sites of deletion or duplication. Quantitative PCR was performed with an TaqMan assay as described earlier.18
Summary of investigated aberrations with reference to respective deletion size and SNP content, and estimation of 100K array sensitivity deduced from its SNP coverage and extrapolation of 10K results
METHODS
Chip hybridisation
We prepared the samples for chip hybridisation according to the manufacturer’s instructions (Affymetrix Inc., Santa Clara, CA, USA), using 250 ng DNA of each proband. We used the GeneChip Scanner 3000 (Affymetrix Inc.) for reading the hybridisation signals and analysed the data using the GDAS program (version 2.0; Affymetrix Inc.).
In this study we initially used a pre-commercial release version (Early Access; EA) of the GeneChip Mapping 10K Array, and repeated some experiments with the commercial GeneChip Mapping 10K Array.19 From the 10 043 SNPs on the EA array, 9684 were autosomal, 178 were X linked, and there was no unambiguous physical position available for 181. The physical map used was based on NCBI build 33 (April 2003). Of the 11 555 SNPs on the GeneChipTM Mapping 10 K Array, 301 SNPs were X linked and 360 were not physically mapped in NCBI build 34. The SNP annotation files (available on http://www.affymetrix.com), include the genetic positions of the SNPs related to the deCODE, Marshfield, and SLIM1 maps.
Quality control of genotyping data
The correct relationships in families (parent/offspring) were checked by the program GRR (Graphical Relationship Representation),20 which used 9684 autosomal markers from the 10 043 SNPs and calculated the identity by state mean and SD for each pair in the sample set. Unrelated individuals, monozygotic twins, sibling pairs, and parent/offspring relationships could be easily distinguished from each other and also from half siblings, grandparent/grandchild, uncle/nephew, and other relationships, which show overlapping clusters. Mendelian segregation errors were detected using PedCheck.21
Statistical analysis
For each region, physical and genetic length and the number of ME were determined. Changes in DNA copy number and contiguous point analysis (CPA) p values were estimated for 8941 SNPs common to both the EA array and the GeneChipTM Mapping 10K array using the method developed by Huang.22 Chromosome copy number analysis jointly uses the perfect match (PM) intensity and the discrimination ratio (PM-MM/PM+MM) to estimate copy number and to assign a probability to the reliability of the observation. For each SNP and its genotype (AA, AB, BB) the log average intensity follows a Gaussian distribution. Mean and variance of this distribution were estimated from a set of normal reference samples. Each test sample was compared with the distribution of the female reference set sample to obtain the significance. As the individual test statistic  is assumed to have a standard Gaussian distribution and SNPs are assumed to be independent, the equation for any given stretch in the genome starting at point m and ending at point n, is:

This score  can be converted to a probability, which is called the CPA p value. A candidate stretch is defined starting at point m and ending at point n as:

The starting point is from the beginning of the chromosome, and a search is performed for such candidate stretches until the end of the chromosome. CPA assumes that the greater the number of consecutive SNPs displaying the same type of alteration (gain or loss), the greater the confidence in the significance of the changes.
Visualisation of data
The Chromosome Copy Number Tool (http://www.affymetrix.com/support/developer/tools/affytools.affx) calculates the copy number, LOH, and p values for either single SNPs or CPA p value for neighbouring SNPs in which copy number is either higher or lower than 2. The results can be plotted for each chromosome separately. For a quick whole genome view of the copy numbers, CPA p values, genotype calls (homozygote, heterozygote, or no call), and ME, we wrote a Perl/TK script (available from FR upon request). Copy numbers >2 are plotted with green bars, copy numbers <2 are represented by red bars. Log10 CPA p values corresponding to an amplification are plotted positively with green bars and corresponding to LOH are plotted negatively with red bars. Mendelian errors are plotted by diamonds. Genotype calls are plotted by dots corresponding to homozygote (pink), heterozygote (blue), and no calls (brown).
RESULTS
Mendelian errors
Initially, we evaluated whether Mendelian inheritance errors (ME) in parent/offspring trios would be indicative of chromosomal aberrations. Therefore, we analysed genotypes of parents and patients from individual array hybridisation experiments for apparent MEs. Isolated ME events within stretches of homozygosity were common, occurring at an average of 8.1 per patient with a range of 2–13, but coincided with the disease related region in only one patient (P5) (fig 1A). Likewise, only two of eight homozygous regions with two ME identified the disease related deletion site (P1 and P20), while four stretches of homozygosity with at least three ME each correctly identified the disease related deletion (P9, P11, P14, and P19). In addition, we found a region where exactly the same three adjacent SNPs showed ME in two patients (P12 and P19). This region contains no known transcript and lies within chromosomal band 8q24.23 (137.7 Mb, build 34) encompassing rs2256827, rs2256821, and rs3844033, all contained in BAC clone RP11-356M23 (AC021621.9). To confirm a deletion, we performed metaphase FISH with this and two flanking clones (RP11-354A3, RP11-610E3) and confirmed a true deletion in both patients (fig 1B). In both cases, FISH analysis showed that this small deletion was inherited each from one healthy parent (paternal in P12 and maternal in P19). Therefore, we conclude that this is a novel common ∼150 kb deletion polymorphism containing no known genes.

Detection of microaberrations by Mendelian segregation errors (ME) in extended homozygous regions. (A) Overview of numbers of stretches of homozygosity with 1–7 ME per patient (P1–P20). *, Sites with known deletion; !, site with newly discovered deletion. (B) Genotyping data of the 8q24.23 region with three ME in one stretch of homozygosity in trios 12 and 19 (F, father, M, mother, P, patient). Paternal genotypes are blue, maternal red; homozygous region in patients are yellow. Red bar on the right side represents location of BAC clone RP11-356M23, showing only a very faint red fluorescent signal on one homologue of chromosome 8 by FISH analyses in patients P12 and P19 (arrows), thus demonstrating a true hemizygous deletion of most parts of the BAC clone used. A subtelomeric green labelled 8p BAC was cohybridised as control. Black bars represent flanking BACs RP11-354A3 and RP11-356M23, revealing normal signals on both chromosomes (data not shown).
In summary, by analysing ME within stretches of homozygosity and scoring three or more ME as significant, we would have identified the deletion in only four cases with deletions ⩾10 Mb. Nevertheless, we identified a previously unknown common ∼150 kb deletion polymorphism in two patients and one each of their parents.
Copy number and contiguous point analysis
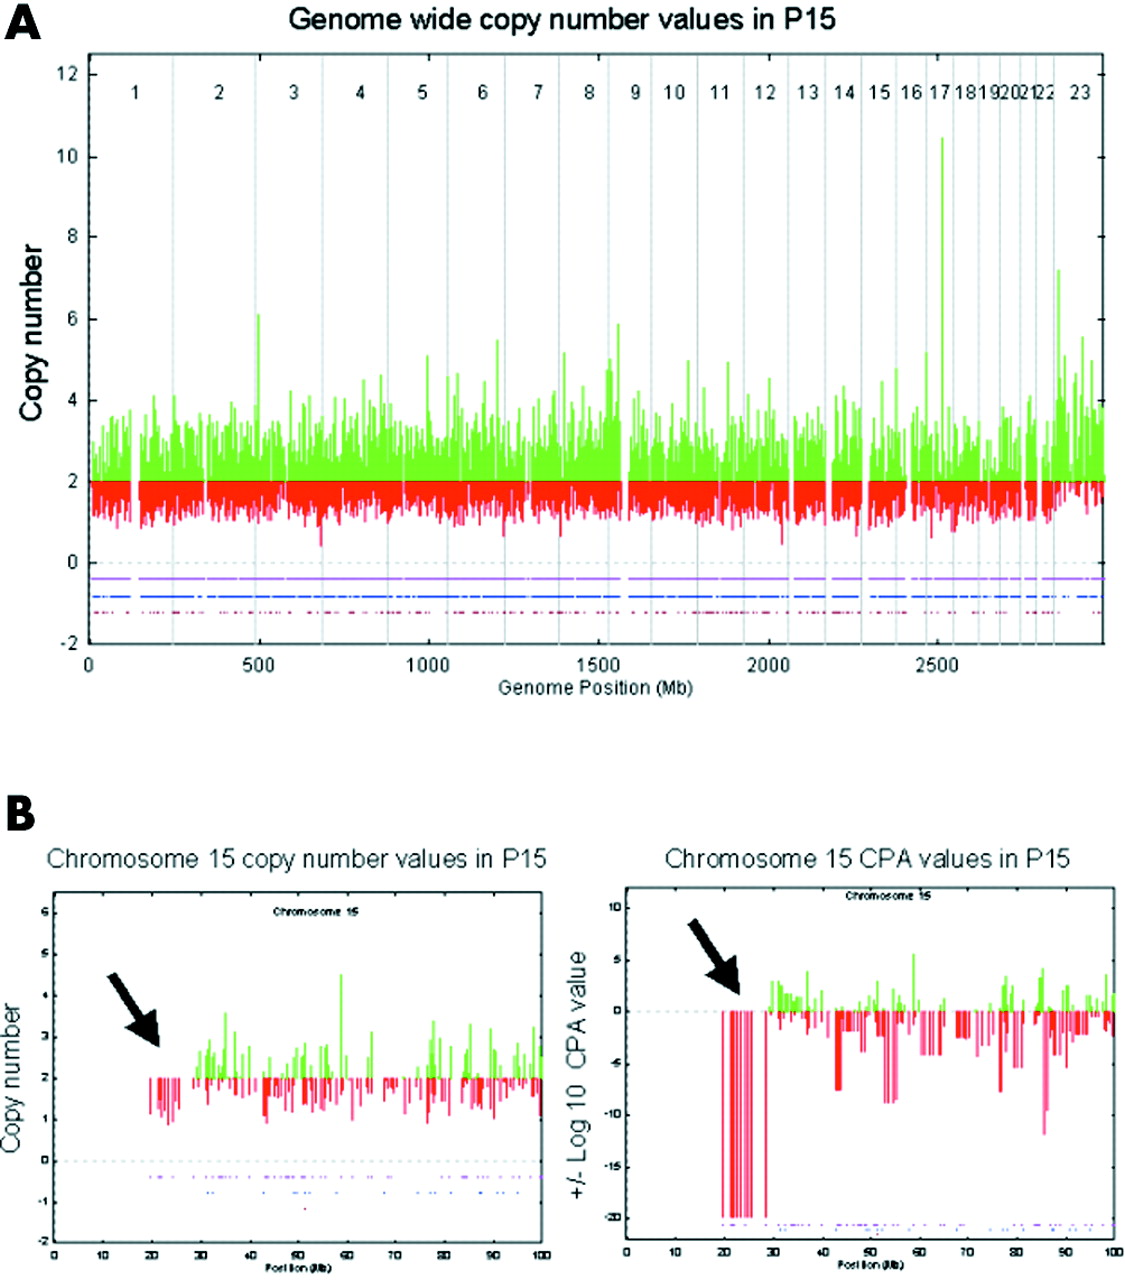
We investigated variation in fluorescence intensity of single SNP hybridisations of individual patients compared with a reference set derived from a control panel of about 100 healthy individuals. We used this information to calculate a copy number value for each SNP. However, when scoring was performed unaware of the patient’s karyotype, we were unable to distinguish between general background noise and areas of true deletions or duplications (fig 2A). To improve discrimination, we introduced a statistical approach, CPA, which uses intensity information from neighbouring SNPs to assign a probability to the reliability of each copy number observation (fig 2B,C). On the initially used pre-commercial EA arrays we observed CPA p values of +20 to −20 log10, but mostly within a range of ±10. In eight patients we observed a single site of adjacent SNPs with a CPA p value of −20, encompassing between 14 and 53 SNPs, each indicating the known deletion site (table 1). A total of five smaller deletions ranging between 3 and 3.7 Mb could not be identified with the EA array because their CPA p values were indistinguishable from background. These areas were less well covered by SNPs, with 1–5 SNPs/deletion, respectively. In addition, seven deletions were undetectable owing to lack of any SNP within the respective deletion site. With reference to duplications, we observed positive CPA p values of 5–20 on average 3.35 times per patient (range 0–14). These sites, however, did not include the known duplication site, which was not distinguishable from background with the EA 10K chip.

Display of genomewide genotypes and respective copy numbers (A) and amplified view of chromosome 15 copy numbers (B) and contiguous point analysis (CPA) p values (C) in patient P15 as obtained by hybridisation of a pre-commercial early access array. Genotype calls are plotted by dots corresponding to homozygote (pink), heterozygote (blue), and no calls (brown) in lower part of panels. Although genomewide copy numbers were inconclusive, CPA p values revealed a deletion on chromosome 15 (arrows).
As the commercially released GeneChip Mapping 10K array had improved SNP coverage and better signal to noise ratio, we reanalysed six patients (P2, P4, P5, P12, P16, and P17) to investigate whether we could detect the aberrations with the new array. Performance of this array was indeed much better, with common CPA p values of ±5 and only 1–4 clusters of at least three SNPs per patient exceeding a CPA p value of ±8 (table 2, figs 3A,B and 4A). In one patient showing generally lower CPA p values (±3) we observed only one cluster of four SNPs with a CPA p value >5. Clusters of more than three SNPs with a CPA p value of ⩾8 in hybridisations with generally higher values and with a CPA p value of ⩾5 in hybridisations with lower values were therefore defined as “peaks”. By this definition we received a total of 12 peaks; nine suggesting a deletion and three a duplication. Six of these 12 peaks encompass the disease related aberrations (five deletions and one duplication).
Overview of peaks revealed with the GeneChip Mapping 10K SNP array

Genomewide CPA p values revealed with the GeneChipTM Mapping 10K array in patients P5 and P17. Only peaks containing three or more SNPs were considered true signals. (A) Genomewide plot of CPA p values correctly identified disease related deletion on chromosome 10 and a duplication on chromosome 22 in patient P5. In contrast to the true signals, the peak on chromosome 4 was not reproducible by a repeat hybridisation. (B) Genomewide plot of CPA p values correctly revealing significant peak for a deletion on the X chromosome in patient P17 (female). The peak on chromosome 9 was not considered true, as it was not reproducible and contained two heterozygous SNPs.
To test the reliability of the unexplained peaks we repeated two hybridisations (P5 and P17). Two of the three unexpected peaks were not reproducible in these repeat experiments (P5, chromosome 4; P17, chromosome 9). In addition, one of these deletion peaks (P17, chromosome 9) had two heterozygous SNPs well within the peak region (data not shown). One duplication peak was investigated by quantitative PCR (P12, chromosome 2) and showed normal copy number results. A further deletion peak (P12, chromosome 11) was investigated using FISH, which showed also normal copy numbers. Thus, we considered these to be false positives. One unexplained peak in patient P5 (chromosome 5), although reproducible, was mainly produced by a single SNP with a very low copy number within a region without known genes, and were thus considered unlikely to be disease related and was not investigated further (table 2). The remaining peak disclosed a previously unknown deletion of about 700 kb in patient P16, which was confirmed by metaphase FISH with several BAC clones (fig 4A,B). This deletion contains two known genes of unknown function (PACR3 and BMP2K) and a pseudogene (GK2). However, as this deletion was inherited from the patient’s healthy father, we regard it as a deletion polymorphism. Thus, using this peak definition, we could correctly identify all subtle deletions and duplications covered by at least three SNPs (table 1) and two presumed or confirmed deletion polymorphisms, while only four peaks proved to be false positives (table 2).

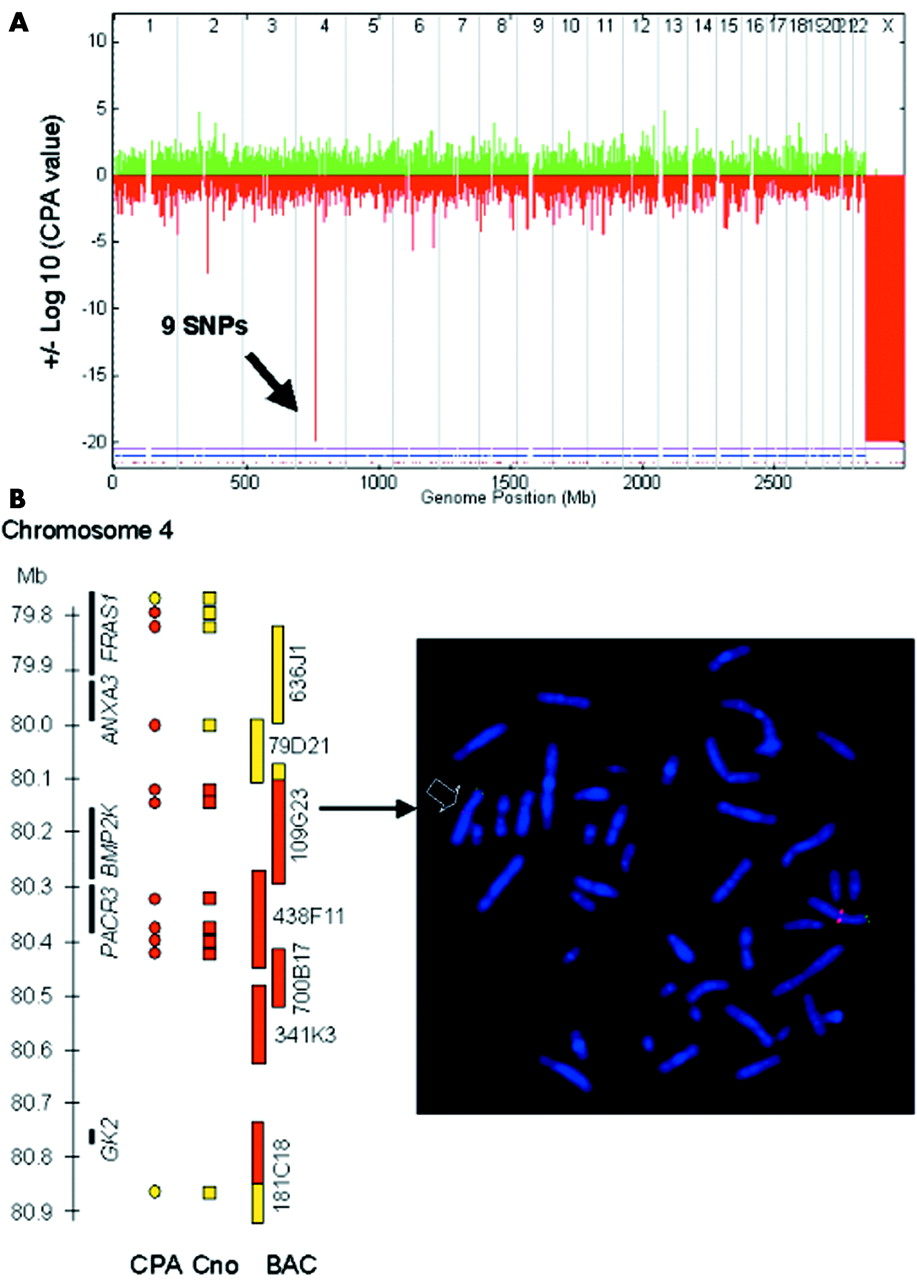
Identification of a previously unknown 0.7 Mb deletion polymorphism in patient P16 by GeneChip Mapping 10K array. (A) Genomewide display of CPA p values clearly reveals male sex (monosomy X) as well as a new deletion polymorphism on chromosome 4 at 80 Mb. (B) Left panel: scheme of deleted region illustrating that the copy numbers (Cno) within a CPA value peak give a better deletion size estimate than the number of SNPs with a significant CPA value. Black bars represent genes, circles and rectangles represent SNPs (yellow circles, CPA p = 0.3–0.5; red circles, CPA p = −20; yellow rectangles, copy number value >1.4; red rectangles, copy number value <1.2), yellow and red bars represent BACs from the RP11 library (yellow, normal signal on both chromosomes 4; red, deletion on one chromosome 4; yellow/red, significantly reduced signal on one chromosome 4). Right panel: representative FISH result confirming newly discovered deletion polymorphism on chromosome 4. Note significantly reduced signal of the red labelled BAC probe RP11-109G23 on one homologue of chromosome 4 (arrow) confirming a deletion in 4q21.23 in patient P16, which was inherited from his father (data not shown). Remaining tiny signal indicates partial deletion of the BAC used. A subtelomeric green labelled 4p BAC was cohybridised as control.
Sensitivity was not only dependent on size of aberration but on SNP content. While the known 3.5 Mb deletion on chromosome 17 in patient P16, covered by only two SNPs, was not identifiable (CPA p = −1.3), a previously unknown deletion of about 700 kb containing six adjacent SNPs within 300 kb (CPA p = −20 in 9 SNPs) on chromosome 4q21.23 was readily detected (fig 4A). It is noteworthy that the common deletion polymorphism on chromosome 8 identified through ME analysis, although showing relatively negative CPA p values in deleted individuals (EA array: deleted P12 (−7.2), deleted F12 (−8.7), M12 (3.1), deleted P19 (−4.9), deleted M19 (−6.3), F19 (−0.3)), generally did not reach significance level according to our definition. This could be explained by skewing of the hybridisation intensity values in the reference dataset towards lower intensities, due to presence of the deletion polymorphism in the control panel used. Accordingly, the centre SNP, rs2256821, showed good average hybridisation intensity but dispersed distribution (data not shown).
Estimation of deletion size
Usually, the size of the aberration was overestimated by the CPA p value, as this method includes information on hybridisation intensities from neighbouring SNPs. However, copy numbers of individual SNPs within a given CPA p value peak allowed a more precise sizing of an aberration, as illustrated in fig 4B.
DISCUSSION
We have devised a new method for molecular karyotyping by hybridisation of small amounts of genomic DNA onto SNP containing microarrays. Using fluorescence intensity information from clusters of neighboring SNPs (CPA p value method) to estimate copy number in individual patients compared with a control panel proved to be an excellent tool to detect known as well as novel subtle germline aberrations in patients. The closer the SNPs showing reduced or increased hybridisation intensities, the more significant the CPA p value, thus increasing the probability for a true deletion (monosomy) or duplication (trisomy). Through investigation of well characterised patients with distinct phenotypes caused by 21 subtle, previously identified chromosomal imbalances of variable size, we were able to delineate sensitivity and specifcity of this method. Based on blinded analysis of our data we were able to define a peak as significant when it contained at least three SNPs with a CPA p value of ⩾8. In hybridisations with generally very low CPA p values, a cut off level of 5 was similarly conclusive. By using this definition, CPA p value peaks obtained from single hybridisations with the GeneChip Mapping 10K SNP array proved highly sensitive and specific, allowing for detection of aberrations as small as 700 kb. This exceptional sensitivity, however, did not apply genomewide, as we found that the number of SNPs covered by the aberration but not its size is critical for detection. Thus, while all aberrations of at least 5 Mb could be reliably detected, 7 of 10 different deletions of 0.2−3.7 Mb in size were unidentifiable, owing to insufficient SNP coverage. As the 100K SNP array, which will be available soon, provides a much denser SNP distribution, we estimate that by using this method, all aberrations in our test panel would have been detected, with the only exception of one very small deletion (192 kb) in a region of relatively low SNP density (table 1). However, as studies to detect subtelomeric aberrations have shown that the average size of aberrations undetected by routine karyotyping is about 10 Mb, with 15% of rearrangements <1 Mb and 15% >20 Mb,23 molecular karyotyping with the GeneChip Mapping 10 K array already exceeeds both conventional karyotyping and high resolution metaphase CGH methods.24
For large scale use of molecular karyotyping, specificity of peaks has to be high, to minimise the workload necessary to confirm results by alternative methods. This prerequisite is fulfilled with our molecular karyotyping approach using our peak definition, as it resulted in an average of only 0.5 false positive signals per patient with a single hybridisation. In contrast, the only matrix CGH array for which specificity has been investigated produced an average of six false positive signals per proband with a single hybridisation and 0.1 with two hybridisations.8 Therefore, each patient required two hybridisations with different control samples to reduce peak numbers. This difference is probably due to the fact that our method compares test DNA against normal data derived from a control panel of about 100 individuals, while CGH based methods use only single individuals co-hybridised with the test DNA. This broad reference panel has the added advantage that common deletion polymorphisms, such as the one we detected through analysis of Mendelian inheritance errors in patients P12 and P19, are filtered out, as evidenced by insignificant CPA p values in this region. Thus this approach reduces the number of signals unrelated to disease, reducing the effort required for validation of potentially significant peaks with other methods. A further advantage of our method is that some of the false positive signals can be easily identified without further experiments, because of the genotype information available with the same experiment.
Nevertheless, not every true signal in our patients corresponded to disease related aberrations. The high sensitivity of this method still allows detection of less frequent genomic polymorphisms not commonly represented in the control panel. We detected a hitherto unknown 0.7 Mb deletion containing two known genes in patient P16. As this deletion was inherited from his healthy father, we conclude that it is unrelated to any malformation or mental retardation, at least in the heterozygote condition. We anticipate that this method will allow the identification of further genomic regions that show no haploinsufficiency but that may nevertheless contribute to human pathology when both copies are deleted.
In summary, we have produced a reliable method to perform molecular karyotyping with high sensitivity and specificity, which can be easily used by many laboratories worldwide. This is not only an important prerequisite of a screening tool for detection of novel disease related structural defects or single gene disorders, but also for its use in routine karyotyping when testing material is limited or when speed of analysis is essential. Finally, array hybridisation techniques such as this have vast potential for automation. We thus envision that this procedure may revolutionise both research and diagnostics of genomic disorders.
Acknowledgments
We are grateful to M Kirsch and L Klassen for expert technical assistance and to the families for their cooperation. We are indebted to K Sperling for critical comments on the manuscript. This study was supported in part by grants from the German National Genome Research Network (NGFN) to P Nürnberg.
REFERENCES
Footnotes
-
Research funding for J Huang and K Jones was provided by Affymetrix, Inc.