Article Text

Abstract
Background Craniosynostosis can be caused by both genetic and environmental factors, the relative contributions of which vary between patients. Genetic testing identifies a pathogenic mutation or chromosomal abnormality in ∼21% of cases, but it is likely that further causative mutations remain to be discovered.
Objective To identify a shared signature of genetically determined craniosynostosis by comparing the expression patterns in three monogenic syndromes with a control group of patients with non-syndromic sagittal synostosis.
Methods Fibroblasts from 10 individuals each with Apert syndrome (FGFR2 substitution S252W), Muenke syndrome (FGFR3 substitution P250R), Saethre–Chotzen syndrome (various mutations in TWIST1) and non-syndromic sagittal synostosis (no mutation detected) were cultured. The relative expression of ∼47 000 transcripts was quantified on Affymetrix arrays.
Results 435, 45 and 46 transcripts were identified in the Apert, Muenke and Saethre–Chotzen groups, respectively, that differed significantly from the controls. Forty-six of these transcripts were shared between two or more syndromes and, in all but one instance, showed the same direction of altered expression level compared with controls. Pathway analysis showed over-representation of the shared transcripts in core modules involving cell-to-cell communication and signal transduction. Individual samples from the Apert syndrome cases could be reliably distinguished from non-syndromic samples based on the gene expression profile, but this was not possible for samples from patients with Muenke and Saethre–Chotzen syndromes.
Conclusions Common modules of altered gene expression shared by genetically distinct forms of craniosynostosis were identified. Although the expression profiles cannot currently be used to classify individual patients, this may be overcome by using more sensitive assays and sampling additional tissues.
- Craniosynostosis
- Apert syndrome
- Muenke syndrome
- Saethre-Chotzen syndrome
- expression
This is an open-access article distributed under the terms of the Creative Commons Attribution Non-commercial License, which permits use, distribution, and reproduction in any medium, provided the original work is properly cited, the use is non commercial and is otherwise in compliance with the license. See: http://creativecommons.org/licenses/by-nc/2.0/ and http://creativecommons.org/licenses/by-nc/2.0/legalcode.
Statistics from Altmetric.com
Craniosynostosis (CRS), the premature fusion of one or more of the cranial sutures, affects 1 in every 2100–2500 children and requires multidisciplinary management to address potential complications, which include raised intracranial pressure, problems with vision, hearing, breathing and feeding, learning difficulties, and significant cosmetic deformity.1
CRS is very heterogeneous, in both presentation and aetiology. Patients may variously be classified according to which sutures are fused, the association with identified genetic or environmental risk factors, the presence of additional clinical features suggestive of a syndrome, or the identification of a causative genetic mutation or chromosomal abnormality. About two-thirds of patients have non-syndromic synostosis affecting a single suture, the sagittal suture being most commonly involved (accounting for up to 50% of all individuals with CRS).1 Non-syndromic sagittal synostosis (NSS) occurs in males about four times as often as in females, but no other genetic risk factors have been consistently demonstrated, and epidemiological evidence indicates that the genetic contribution to this disorder is largely polygenic.2–4 Although intrauterine fetal head constraint is suspected to represent an important risk factor for sagittal synostosis,3 5 it is challenging to prove this in individual cases because objective data on fetal head constraint are difficult to obtain.
At the other end of the spectrum of causation, a specific genetic aetiology (either single gene mutation or chromosome abnormality) can be identified in ∼21% of patients, the majority of whom have additional clinical features indicating the presence of a syndrome.6 Heterozygous mutations in the fibroblast growth factor receptor type 2 (FGFR2) and type 3 (FGFR3) genes, and the TWIST1 gene, are most commonly identified.7 The FGFR2 and FGFR3 mutations usually encode specific missense substitutions that confer gain-of-function to the mutant receptor tyrosine kinase, whereas the TWIST1 mutations are heterogeneous and result in loss-of-function (haploinsufficiency) of the encoded basic helix–loop–helix transcription factor. The most common individual CRS-related substitutions are S252W and P253R in FGFR2 (causing Apert syndrome; AS) and P250R in FGFR3 (causing Muenke syndrome; MS)6 8; TWIST1 mutations are diagnostic of Saethre–Chotzen syndrome (SCS).9
Genetic counselling for families affected with CRS is straightforward when the proband has either non-syndromic midline suture synostosis (risks are relatively low and empiric data can be used) or an identified genetic alteration (genetic testing identifies those individuals at risk). However, it is much more challenging in the minority of cases (∼15–20%)6 in whom either a syndrome is suspected (based on positive family history, additional dysmorphic features or learning disability), or multiple cranial sutures are fused, but where all currently available genetic tests are negative. This situation is clearly unsatisfactory as the various aetiological possibilities in this situation (dominant, recessive, polygenic) are associated with very different recurrence risks.
To provide an alternative approach to the investigation of causation, we sought here to identify a characteristic signature, based on finding altered patterns of mRNA expression in fibroblasts, that could potentially provide a biological marker of genetically mediated CRS. We chose to analyse fibroblasts for two reasons. Firstly, these can readily be cultured at the time of craniofacial surgery from a small biopsy sample of scalp skin, enabling the standardisation of the sampling protocol and greater simplicity for diagnostic purposes. Secondly, fibroblasts are developmentally related to osteoblasts, which have been described as ‘sophisticated fibroblasts’,10 and therefore represent a particularly relevant cell type in the context of CRS. By comparing the expression patterns in three of the most common genetic types of CRS with NSS cases, we have identified shared modules of altered gene expression in the syndromic groups that indicate a common pathogenetic pathway involving cell-to-cell communication and signal transduction. These results provide a starting point for a new functional method of classifying CRS based on the mRNA expression profile.
Subjects and methods
Patients and samples
Ethics approval for the work was obtained from the Oxfordshire Research Ethics Committee (C02.143). Patients with suspected diagnoses of AS, MS and SCS were screened for mutations in FGFR2, FGFR3 and TWIST1, respectively, by restriction digest, denaturing high-performance liquid chromatography (Transgenomic WAVE System) and DNA sequencing of appropriate PCR products.8 Patients with TWIST1 mutations from whom we obtained samples were all reported on previously.11 Patients with NSS were screened for all common mutations in FGFR1, FGFR2, FGFR3 and TWIST1.6 At operation, a transverse incision was made across the vertex of the scalp, and a strip of skin (∼2 cm ×0.3 cm) was removed from the incision site before closure. In two cases of AS, skin was taken from the hand at the time of a corrective procedure. Online supplementary table 1 summarises the mutational data, site of tissue sampling, and age of the patient when each sample was obtained. For the microarray studies, the average age at sampling ranged from 1.40 years for the NSS group to 3.96 years for the MS group, the difference in age was not statistically significant for any of the groups (t test).
Skin was cultured at 37°C with 5% CO2 in Dulbecco's modified Eagle's medium (Invitrogen, Paisley, UK) supplemented with 10% fetal calf serum (FCS; catalogue Nos A15-041 and A15-043, PAA Laboratories GmbH, Pasching, Austria) and frozen in 50% FCS for storage. Frozen cells were thawed and grown to ∼70% confluency in a 75 cm3 flask before RNA extraction. All analyses were conducted on cells passaged between three and five times.
RNA extraction and microarray processing
Total RNA was extracted using TRIzol (Invitrogen) following the manufacturer's protocol. The quality of RNA samples was evaluated using the Agilent Bioanalyzer 2100 (Agilent Technologies, South Queensferry, UK). Only samples with preserved rRNA ratio (28S/18S) and no evidence for RNA degradation were analysed further.
RNA labelling and hybridisation used protocols, reagents and equipment supplied by Affymetrix, High Wycombe, UK. A 2 μg portion of total RNA from each sample was labelled with the One-Cycle cDNA Synthesis and One-Cycle Target Labelling and Control Reagent kits. Then 10 μg of the resulting biotin-labelled fragmented cRNA was hybridised to GeneChip Human Genome U133 Plus 2.0 arrays, which identify over 47 000 transcripts. After hybridisation at 45°C for 16 h (Hybridisation Oven 640), microarrays were washed and stained with streptavidin–phycoerythrin conjugate in a Fluidics Station 450, and scanned with a GeneChip Scanner 3000.
Microarray data analysis
After array scanning, quality control (QC) was performed with GCOS software (Affymetrix). All QC measures (scaling factor ≤3-fold difference within a study; 3′/5′ ratio for probe sets for GAPDH ≤3; present (P) calls in the same range for all samples in the study and RawQ below 100) were in the acceptable range for all samples. The .CEL data files have been deposited in ArrayExpress (accession No E-MEXP-2236).
Affymetrix GeneChip .CEL files were analysed in R (see http://www.r-project.org) using the Bioconductor packages (http://www.bioconductor.org) for QC analysis, data normalisation, hierarchical clustering, and identification of differentially expressed transcripts. Specifically, the data were normalised using Robust MultiChip Analysis,12 and differentially expressed genes were identified using Statistical Analysis for Microarrays (SAM) with a false discovery rate cut-off of 5%.13 Prediction Analysis for Microarrays (PAM) was implemented to determine if a gene set could be identified that classified the arrays correctly when cross-validation was applied.14 Both unsupervised and supervised two-way (genes against samples) hierarchical clustering methods were used to establish the relationships among samples and to check if the individual samples clustered together according to similarity in their expression signatures. Hierarchical clustering was performed with Genesis software using complete linkage clustering.15
Gene lists produced using the above methods were subsequently imported into Ingenuity and mined by Ingenuity Pathways Analysis (IPA) (Ingenuity Systems, US; http://www.ingenuity.com). This core gene list was analysed for gene annotation enrichment using the Database for Annotation, Visualisation and Integrated Discovery (DAVID) 2008; the enriched functional annotation terms associated with each gene were identified and listed according to their enrichment p value (http://niaid.abcc.ncifcrf.gov/).16 17
Quantitative real-time PCR
To validate the gene expression measurements independently, we performed quantitative reverse transcription PCR (RT-PCR) on three genes (HLA-DPA1, MMP1 and TGFBR2) using predesigned ABI Taqman primers, probes and amplification reagents (Assays-on-Demand; Applied Biosystems, Warrington, UK), according to the manufacturer's instructions. Firstly, 2 μg total RNA from each subject was reverse-transcribed with the RETROscript kit (Ambion, Warrington, UK), and the cDNA was amplified by quantitative real-time PCR in an ABI 7500 PCR system (Applied Biosystems). Amplification of the GAPDH gene served as a normalisation control for each sample to correct for minor differences in RNA quality and quantity. The expression ratio was calculated using the 2−ΔΔCT method.18 t Tests were performed to determine significant differences in gene expression, and Fisher exact tests to compare data in 2×2 tables.
Results
Expression profiling of syndromic CRS
We established primary skin fibroblast cell lines derived from scalp skin, from subjects with confirmed diagnoses of AS, MS and SCS, and control subjects with NSS. Ten samples from each diagnostic category were chosen for investigation by expression profiling (online supplementary table 1). RNA from the 40 subjects was hybridised to Affymetrix GeneChip U133 Plus 2.0 microarrays, which comprehensively cover the human transcriptome.
For the first stage of the analysis, we asked whether the samples could be clustered by disease category. Unsupervised clustering of all samples, based on all transcripts on the microarray, produced the dendrogram shown in figure 1. Eight of 10 AS samples located to a cluster that did not contain any NSS controls (p=0.0007), indicating that AS has the most distinctive expression profile among the four patient groups studied. By contrast, the MS and SCS samples clustered poorly, and only a minority (four MS, three SCS) were clearly discriminated from the NSS controls.

Cluster analysis of gene expression in craniosynostosis (CRS). The dendrogram shows the results of unsupervised clustering analysis of 10 samples each of Apert syndrome (AS) (AP_01–AP_10), Muenke syndrome (MS) (M_01–M_10), Saethre–Chotzen syndrome (SCS) (SCS_01–SCS_10), and 10 non-syndromic sagittal synostosis (NSS) controls (C_01–C_10), using information from all the probe sets of the Affymetrix U133 Plus 2.0 arrays.
To identify the transcripts that best discriminated the syndromic patients as a whole from the NSS controls, we used SAM analysis. A total of 1044 independent probe sets, representing 863 different genes, were found to be significantly differentially expressed (online supplementary table 2). Of the 141 genes represented by two or more probe sets, the direction of change in transcription was concordant for the different probe sets in 139 cases, indicating that the great majority of changes observed are real rather than the result of statistical noise. However, supervised clustering using this gene set provided only modest improvement over unsupervised analysis, with nine of 10 AS samples clustered in a single group that contained one MS sample in addition, but no major change in the clustering of MS or SCS samples (online supplementary figure 1).
One factor that might have impeded clustering of syndromic cases from NSS controls is that the different syndromic diagnoses were associated with different expression signatures. We therefore repeated the SAM analysis, comparing each syndromic group (AS, MS, SCS) individually with the NSS controls. This analysis identified 547 (AS), 52 (MS) and 56 (SCS) independent probe sets, representing, respectively, 435 (AS), 45 (MS) and 46 (SCS) differentially expressed genes between the syndromic cases and the NSS controls (online supplementary table 3). In the previous SAM analysis of all syndromic versus NSS controls, 163 of the unique gene entries were also represented. The much larger number of probe sets identified for the AS fibroblasts presumably reflects a more widespread disturbance in cellular homoeostasis, and correlates with the greater phenotypic severity of AS, with regard to both CRS and other skeletal features, compared with either MS or SCS.
Discrimination of individual syndromic samples from controls
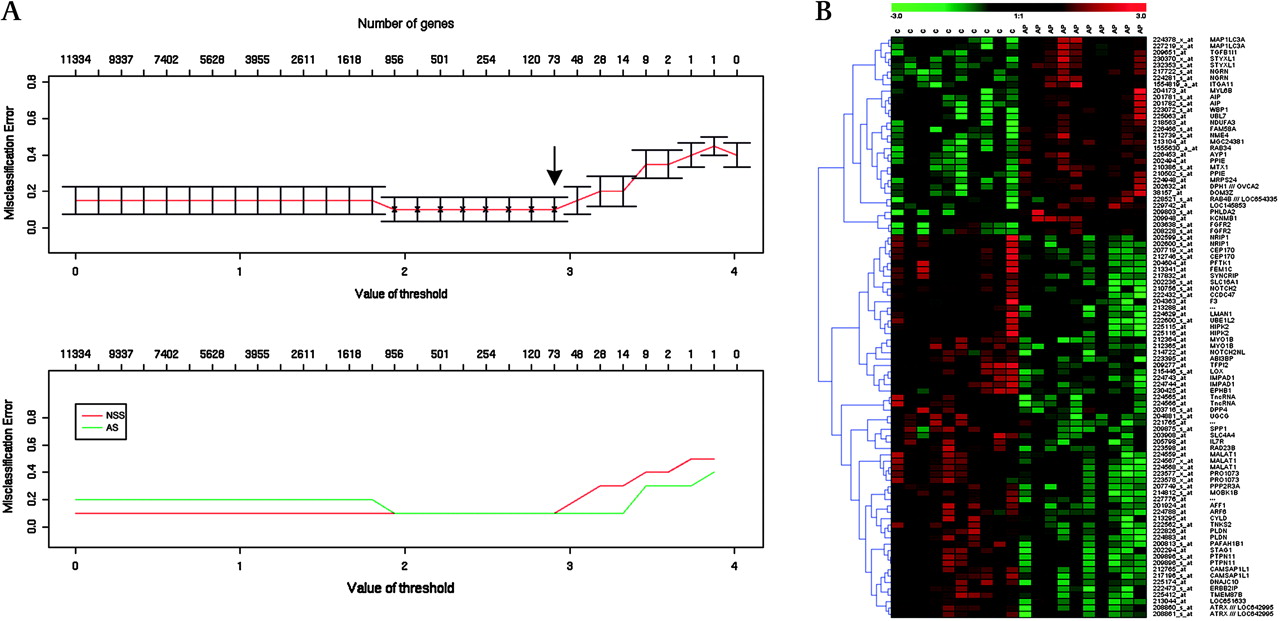
As an alternative approach to testing the use of these data for sample classification, we used PAM analysis for each of the syndromes compared with controls. In the case of AS, satisfactory discrimination from NSS controls (misclassification error ≤0.1) could be achieved by the measurement of 91 transcripts representing 73 genes (figure 2A). Figure 2B shows the heat map obtained when clustering using these genes. However, similar PAM analyses of MS and SCS gave unacceptably high misclassification error (>0.2) and hence poor classification potential (online supplementary figure 2).

Fibroblast expression signature distinguishes Apert syndrome (AS) samples from non-syndromic sagittal synostosis (NSS) controls. (A) Prediction Analysis for Microarrays (PAM) analysis. The upper panel shows the predictive power (measured by misclassification error on the y axis) of the full list of genes (extreme left on the x axis) to a single classifying gene (extreme right of the x axis). The best predictive power, hence smallest misclassification error, is achieved with the top 73 classifying genes (arrow). The lower panel shows the misclassification error for each diagnosis, with the NSS controls in red and AS cases in green. (B) Supervised clustering and heat map generated with the top 73 AS-classifying genes.
These results indicate that, while our analytical procedure was able to distinguish individual AS from NSS samples with good confidence, it was not reliable in the case of individual MS or SCS samples.
Identification of a common CRS syndromic expression profile
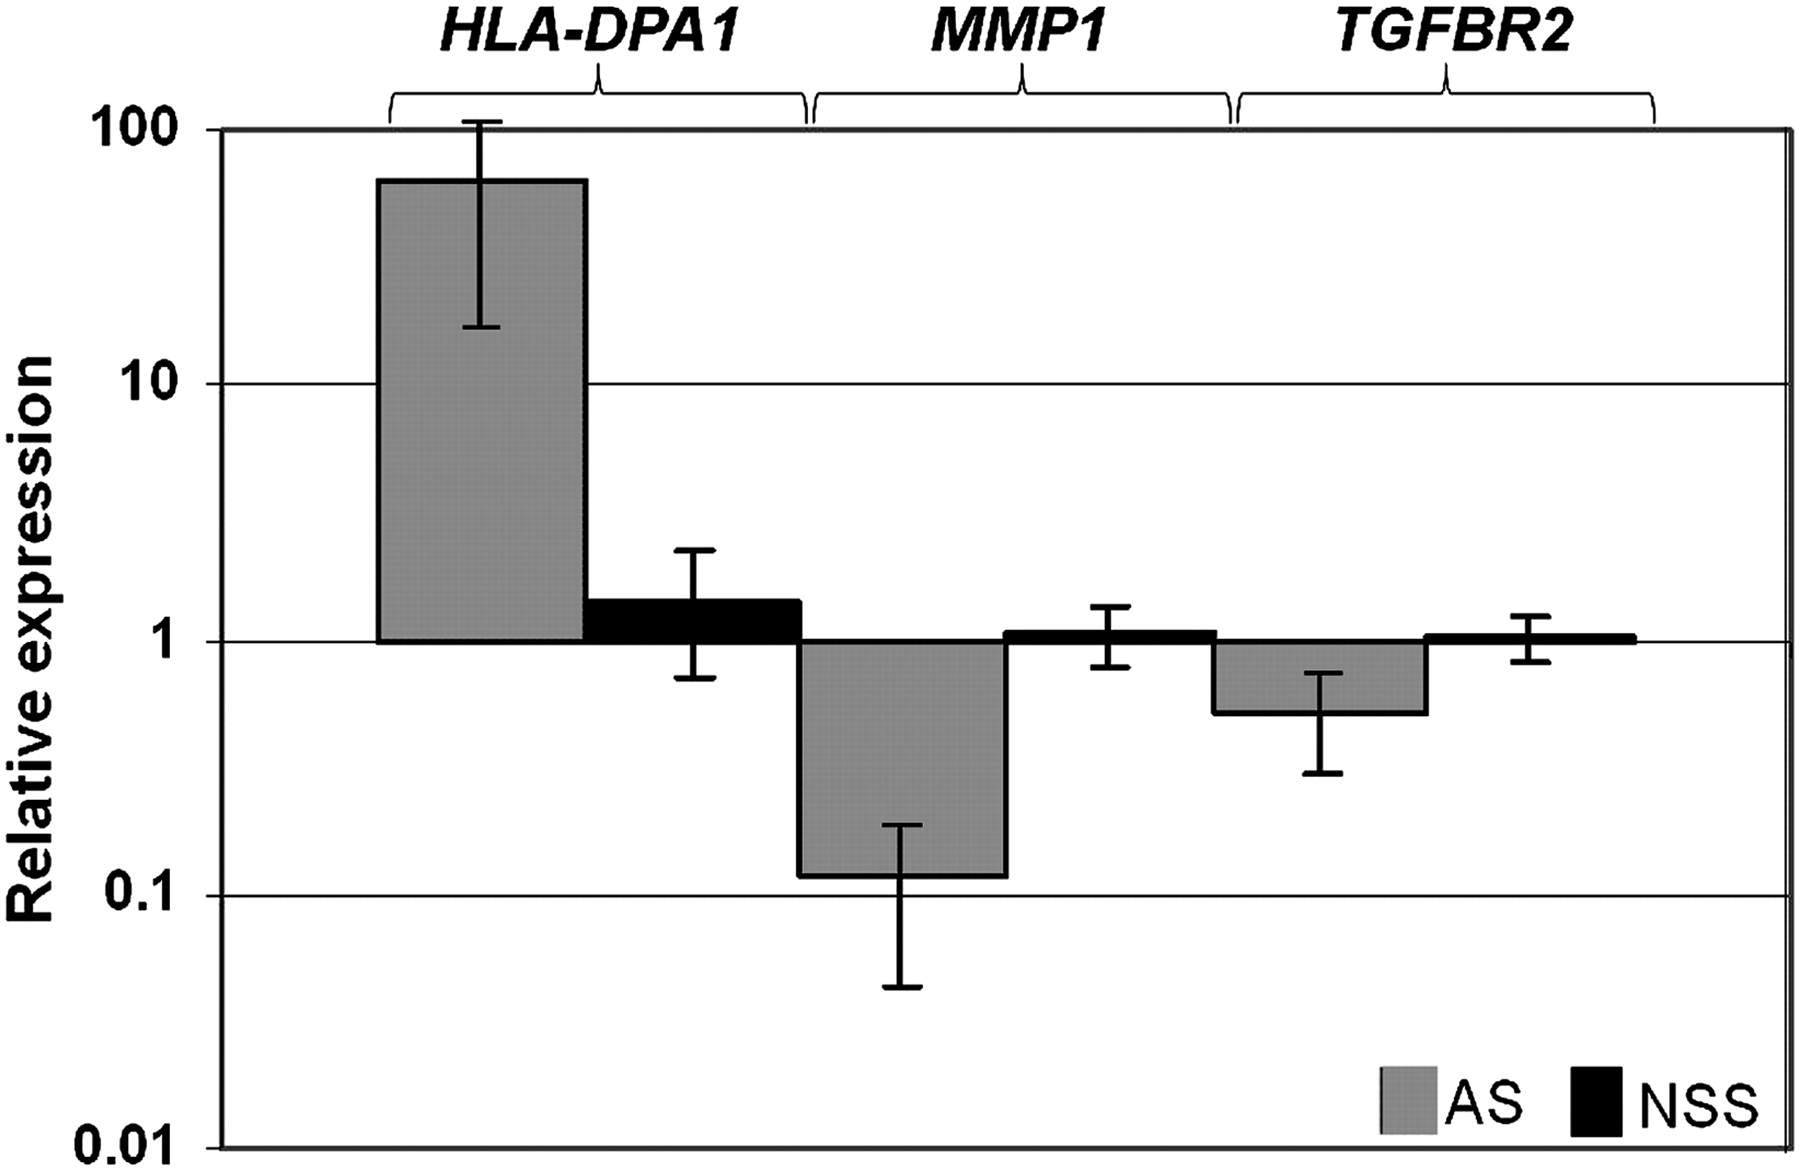
We next asked whether the lists of unique transcripts generated using the separate SAM analyses of each syndrome compared with NSS controls, described above (online supplementary table 3), showed significant overlap. Of a total of 477 transcripts in these lists, 43 featured in two of the lists and three in all three lists (figure 3). All except one of these 46 multiply listed transcripts showed the same direction of change in the different syndromic CRS disorders relative to the NSS group, indicating that these trends were highly non-random (p=10−7). We randomly selected three transcripts significantly altered at least in the AS group for independent assessment by real-time RT-PCR; the genes chosen were HLA-DPA1 (major histocompatibility complex, class II, DP α 1), MMP1 (matrix metallopeptidase 1, interstitial collagenase; also significantly altered in SCS) and TGFBR2 (transforming growth factor beta receptor II (70/80 kDa); also significantly altered in SCS). We analysed both the original samples used in the Affymetrix microarray experiment (not shown), and—for further validation on an independent set of samples—five different AS patients with P253R FGFR2 mutations and five further NSS controls (figure 4). In all cases, the results confirmed the trends originally identified in the microarray analysis, indicating that they were independent of changes in the sample, time of culture, and method of mRNA quantification.

Comparison of syndromic craniosynostosis (CRS) expression profiles. A Venn diagram of the lists from the Statistical Analysis for Microarrays (SAM) analysis corresponding to the three conditions (Apert syndrome (AS), Muenke syndrome (MS) and Saethre–Chotzen syndrome (SCS)) is shown. Genes showing significant alterations in two or more conditions are identified individually; upregulated genes are shown in bold, and downregulated genes in normal type. A single gene (PDE4DIP, underlined) showed an inconsistent direction of change, with upregulation in MS and downregulation in AS.
Real-time PCR (RT-PCR) validation of the expression of HLA-DPA1, MMP1 and TGFBR2 genes in five further AS cases (P253R mutation) and five further NSS controls. The values presented are log-transformed and normalised to GAPDH control gene expression. All the data reached statistical significance (Student t test, p<0.05).
To assess whether particular regulatory networks were enriched in the lists of discriminating transcripts for the three syndromic conditions, we used IPA. This highlighted 22 of the 46 transcripts that had shown differential changes in more than one CRS syndrome compared with NSS controls (figure 3) as belonging to core conserved networks. ‘Network’ genes that showed increased expression in syndromic CRS are ASS1, IL15, ITGA11, PDLIM1, SHROOM3, STMN2 and TPD52L1, and those that showed decreased expression are CA12, DCBLD2, DDX17, DOCK2, HMGA2, ITGA2, ITGA6, MMP1, MT1E, NPR3, PHLDA1, PODXL, RAPGEF2, SPRY2 and THBD. This core list was analysed for gene annotation enrichment using the DAVID algorithm. Highly significant enrichment was identified for encoded proteins involved in cell-to-cell communication and signal transduction (DCBLD2, IL15, ITGA2, ITGA6, ITGA11, NPR3, RAPGEF2, SPRY2, STMN2) (p=0.036), with nine of the proteins integral to the plasma membrane (DCBLD2, IL15, ITGA2, ITGA6, ITGA11, PODXL, RAPGEF2, SHROOM3, THBD) (p=0.0032).
Discussion
In this work we have identified a shared alteration in expression profile in scalp fibroblasts obtained from patients with mutations in the three genes that are most commonly mutated in CRS—FGFR2, FGFR3 and TWIST1. We would expect this profile to indicate common perturbations in gene networks downstream of the mutations, providing insights into the shared pathogenesis of genetically determined CRS (as opposed to NSS, which in most cases has a different, multifactorial origin).
The shared networks identified are likely to reflect the interconnectedness of FGFR2, FGFR3 and TWIST1 in signal transduction events, with similar downstream consequences for cellular phenotype. In the mouse, all three orthologous genes are expressed in different zones of the definitive coronal suture at embryonic day (E)16.19 Twist1 appears to have an earlier role at E14.5 in maintaining the boundary between neural crest and cephalic mesoderm at the site of the developing coronal suture,20 whereas Fgfr2 expression is characteristic of actively dividing cells in the definitive suture.21 The presence of TWIST1 binding sites adjacent to the FGFR2 gene indicates direct transcriptional regulation22; in addition, the sutural mesenchyme of Twist1+/− mice shows greater responsiveness to fibroblast growth factors (FGFs).23 The role of FGFR3 in the cranial sutures is less well defined, but it has been proposed that TWIST1 negatively regulates FGFR3 transcriptional activation induced by its binding partner E2A.24
When considering the genes showing altered expression in more than one CRS syndrome compared with NSS controls (figure 3), we found highly significant trends both in sharing of the direction of altered expression and in the classes of encoded protein affected by these alterations. Together with the replication, using real-time PCR (RT-PCR), of selected expression alterations in samples from fibroblasts of a different set of patients and cultured at a different time (figure 4), this indicates that our findings are robust and point to important biological differences between the fibroblasts of patients with defined CRS syndromes and those with NSS. Of note, it is essential to use a consistent source of FCS during fibroblast culture; in contrast with the data presented here, when we grew fibroblasts in serum sourced from a different manufacturer, expression profiles on microarray analysis appeared dampened, and we observed few significant differences even between the AS sample group and NSS controls (data not shown).
Assessment of the genes showing shared alterations in expression using a combination of IPA and DAVID classification indicates that fibroblasts from the syndromic patients have altered characteristics for cell recognition and signalling. Among genes exhibiting increased expression in syndromic CRS (online supplementary tables 2 and 3), several encode proteins with cytoarchitectural functions. Prominent examples are STMN2 (encoding stathmin-like 2), which showed the highest upregulation of any transcript in both MS and SCS (average of 8.7-fold and 12.0-fold increase respectively), as well as the highest upregulation overall, and SHROOM3 (encoding shroom family member 3), which was upregulated 3.07/3.93-fold in AS and 3.48/4.03-fold in MS. Stathmin-like 2 is a cytosolic phosphoprotein that controls microtubule assembly and dynamics, and is a marker of osteogenesis in mesenchymal stem cells25; shroom 3 is an actin-binding protein that regulates the apical constriction of epithelial cells.26 Genes influencing cell adhesion and extracellular matrix are also prominent. ITGA11, upregulated 3.78-fold in SCS and 2.38/3.37-fold in AS, encodes half of a heterodimeric integrin (α11β1) that functions as a collagen receptor27; by contrast, genes encoding two other integrin subunits, ITGA2 and ITGA6, as well as MMP1 (encoding matrix metalloproteinase 1 (an interstitial collagenase)), were downregulated in the same two disorders. SPP1 encoding osteopontin, the principal phosphorylated glycoprotein of bone, was downregulated fourfold in AS and 3.1-fold in MS, and SPRY2, encoding sprouty 2, a negative regulator of FGF signalling, was downregulated 2.0-fold in MS and 2.9-fold in SCS.
Whereas these data point to a major influence of CRS mutations on downstream gene expression, the SAM analysis did not highlight any significant changes in expression of the mutated genes themselves (TWIST1, FGFR2 or FGFR3) in these samples. In the PAM analysis, however, two FGFR2 probe sets were selected among the 73 genes giving the best discrimination of AS from NSS controls (figure 1). Interestingly, FGFR2 showed relative upregulation in AS cells, which contrasts with previous reports that FGFR2/Fgfr2 expression is either unchanged or reduced in the cranial sutures of AS individuals or mouse models.28–31 Clearly fibroblast culture represents a different cellular milieu from the cranial suture, and we do not expect a simple equivalence of gene expression profiles between the two situations. Nevertheless, it is likely that the altered cellular properties of fibroblasts reflect endogenous properties of the suture, hence the genes that show altered expression are plausible candidates in which mutations may cause CRS. Supporting this, heterozygous mutations in TGBFR2, which showed reduced expression in AS (2.17–2.94-fold; figure 4) and MS (2.08-fold), cause Loeys–Dietz syndrome, in which CRS sometimes occurs.32
Previously, three other studies have profiled gene expression in CRS using microarray analysis of transcripts.31 33 34 These studies investigated different cell types compared with the present work and used diverse array platforms. Carinci et al33 studied periosteal fibroblasts of three patients (AS with FGFR2 P253R mutation, Crouzon syndrome with FGFR2 G338R mutation, and Crouzon syndrome without an identified mutation), using a 19K cDNA array platform. Fanganiello et al34 studied periosteal fibroblasts in seven AS patients with the FGFR2 S252W mutation, using the CodeLink array platform. Coussens et al31 used tissue samples from a combination of fused, fusing and unfused sutures in five patients (AS with S252W mutation, and three sagittal and one unicoronal synostosis without identified mutations), using the same Affymetrix platform as in the present work. By contrast, we chose to undertake expression profiling in fibroblasts (see the Introduction); the relative simplicity of harvesting and culture enabled us to sample a much larger number of patients than described in the previous studies.
We compared the gene lists generated from the two larger previously published studies (262 genes in Fanganiello et al34 and 651 in Coussens et al31) with our list of 863 differentially expressed genes between monogenic CRS and NSS controls (online supplementary table 2). No genes were found in common to all of the lists, and the overlap of genes shared by any two lists was modest (online supplementary figure 3). In none of the three comparisons did the shared transcripts show changes in a consistent direction for syndromic cases or fusing sutures more often than expected by chance. Hence we conclude that, presumably owing to substantial differences in sample sources and methodology, it is not appropriate to combine the results of any of these studies. Notably, our experimental design used fibroblasts from patients with NSS as the ‘control’ comparator group; we did not explore whether these NSS samples might themselves show consistent differences from a non-CRS population. Such an effect could have obscured some of the features of the monogenic CRS expression profile compared with the normal state.
In summary, we have identified an expression profile of syndromic CRS in scalp fibroblasts that exhibits shared features across three of the most common genetically determined syndromes (AS, MS, SCS) that distinguish these samples from NSS controls. As well as demonstrating shared signalling modules in these three syndromes, this observation supports our original reasoning that NSS has a distinct pathological origin. The syndromic CRS profile is robust, based on the consistent direction of change in expression, and replication in independent samples. Although, with the exception of AS, this profile cannot currently distinguish individual samples from NSS, improved sensitivity of the cDNA assay (for example, using deep sequencing methods) should increase signal specificity. Further refinements to this approach may provide a method of classifying individual samples into dichotomous groups with either high or low genetic load, which would assist genetic counselling even when a causative mutation has not been found.
Acknowledgments
We thank the subjects and their families for their participation in this work, Sue Butler for excellent assistance with cell culture, and Chris Babbs and Steve Twigg for comments on the manuscript. We are very grateful to Cordelia Langford (Wellcome Trust Sanger Institute), who helped to pilot an earlier phase of the work reported here.
References
Supplementary materials
Footnotes
Funding This work was funded by the Medical Research Council (support to SS) and the Wellcome Trust (Programme Grant 078666 to AOMW).
Competing interests None.
Ethical approval This study was conducted with the approval of the Oxfordshire Research Ethics Committee (C02.143).
Provenance and peer review Not commissioned; externally peer reviewed.